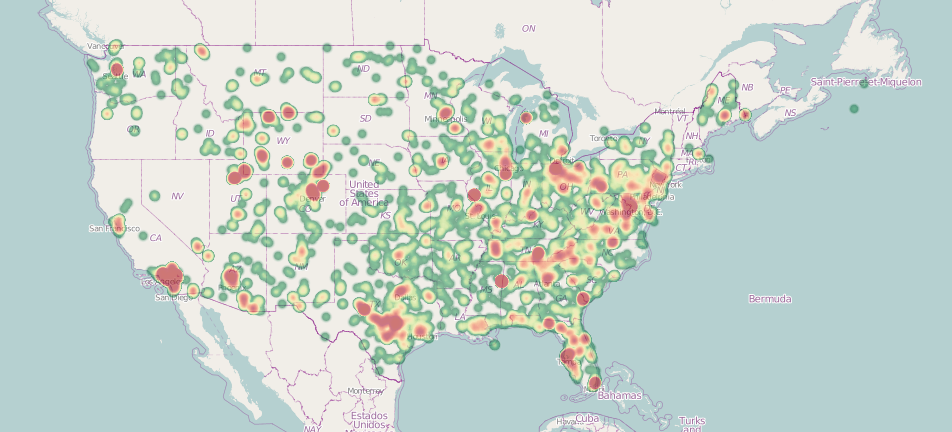
A lot of folks have chipped in to help improve the map of the United States for this past Operation Cowboy weekend. Let’s look at some preliminary stats.
This live view was updated all weekend to visualize where folks have been working:
The interactive map is still online as of the time of writing (and will be for a while, probably) so if you want to drill down to a specific region, just click the map to head over there.
The interactive Operation Cowboy map is part of a comprehensive statistics page that was updated throughout the weekend. On the overview page, we can see that more than 800,000 nodes (points), more than 90,000 ways (lines) and some 600 relations (complex objects, such as boundaries and multipolygons) were edited over the course of the weekend! There were 162 contributors involved, so if you average that, it is evident that some pretty hardcore marathon mapping has been taking place.
A huge thanks to everyone who contributed and made this event happen! We will follow up with more stories about Operation Cowboy as the reports come in.


