OpenStreetMap US community members frequently get together to edit OpenStreetMap together. These mapping parties are a great way to get excited about the map and the process of improving it together. OpenStreetMap US is happy to support these events with promotion and reimbursement for food and drink. If you’re interested in hosting a party in your area, please let us know!
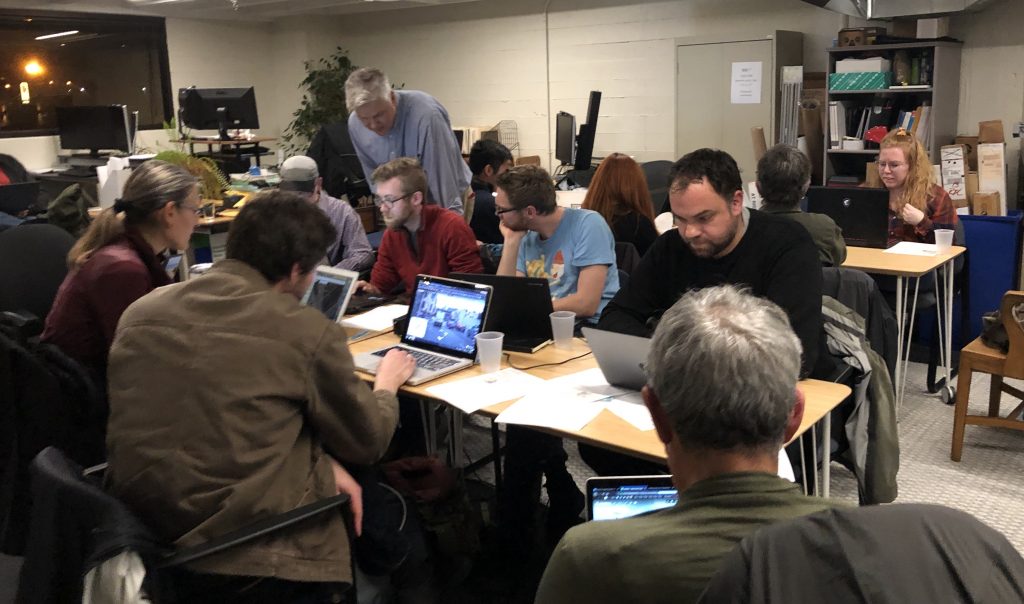
MaptimeSF is a group open to all levels of mappers in the Bay Area, and committed to using open data and open-source tools to make maps. On a rainy night in January, despite a Warriors game against the Denver Nuggets with an amazing first quarter, about 28 mappers gathered at GreenInfo Network in downtown Oakland to use open-source tools to make a Resiliency Map of the low-lying San Francisco neighborhood bounded by Market Street, 10th Street, Berry, and 3rd Street, and can be seen on OSM!
Mappers primarily worked with Nicole Martinelli, who has worked on making community-made open source Resiliency Maps in San Francisco with OpenStreetMap, and cartographer Michael Norelli, who has worked a lot with Mapillary as well as multiple mapping projects with the National Park Service, US Forest Service, and Nature Conservancy, as well as Golden Gate Parks. But many folks who were practiced in mapping offered help and advise to novice mappers who were making their first edits!
Nicole first oriented us to the Neighborhood Emergency Response Team project – of which she’s been a member since 2010. As an active member, she creates maps that detail potential hazards and shelter zones and gets them into the hands of residents of the SOMA area through OpenStreetMap. We were all glad to see the huge sense of accomplishment that many newbies felt making their first OSM edits ton the map, and the feeling of empowerment and learning how to make edits with different tools!
The Mapillary imagery we relied on for the edits was super important in helping develop confidence in making edits, and the excitement in the room grew about using OSM and making further edits in the coming days. The versatility and ease with which edits could be made, as well as the protocol of tagging all edits to the mapathon also made people excited. For anyone interested in working with OSM to add further resiliency data to this neighborhood or to add their own additions to OSM in neighborhoods where they live or work, Nicole offered some resources. Luckily, Mapillary’s visual database is easy enough to navigate and use, and rich enough for the neighborhood we were entering edits, that folks could divide streets, parts of the neighborhoods, and areas, as they wondered whether the roof of the SalesForce Building could fairly be classified as “open space” in OSM, what resiliency-specific data would be best to include on individual blocks, or how to note open spaces under freeways, all were excited to explore the Mapillary-OSM interface as a powerful way to read, engage, and make OSM edits to create Resliency Maps of the SOMA area. Even those experienced in OSM enjoyed the engagement of incorporating the resiliency targets in their work.
After Maptimers opened their OSM accounts, Nicole oriented us to the SOMA neighborhood – of which she is co-ordinator – and gave us a working strategy to use the crowd-sourced Mapillary images of the neighborhood to locate call boxes that we worked to integrate into OSM for future needs. Nicole helped us dive into the OSM records of part of her neighborhood. Nicole reminded us of the need for maps for neighborhoods to respond to possible emergencies like earthquakes or inundation. In San Francisco, we focussed on a single low-lying neighborhood to make edits in OSM to render them all the more useful in emergencies, noting the important assets of the neighborhood that met the very real concerns of many in the state for confronting disasters and emergencies. By making maps that would provide a readily accessible record of assets from emergency phones, we helped improve the resilience of neighborhoods in real ways. Noting the huge role that HOT (Humanitarian OpenStreetMap Team) had in disasters from 2010-11 in Haiti, the community-led response to famine and drought in Somalia and the Horn of Africa in 2011, Nicole and Michael encouraged mappers to turn their attention to fire alarm call boxes, fire boxes, fire hydrants, open areas (like soccer fields, parks, etc.) that could be useful assembly points. We also mapped cisterns for water potentially hazardous sites like areas of construction, paint shops, auto repair stores, and hair salons. Any and all information added to OSM during the Maptime Mapathon was saved with the comment “Mapillary” as our source, and the useful note:
Data collected in MaptimeSF mapathon for Resiliency Maps 1/15/2018.
#resiliencymaps #maptimeSF
Part of the cool aspect of the evening was the huge levels of experience that were present at the Mapathon, and the broad interest the two-hour workshop generated in using OSM tools. The attendees this evening included not only some of the leaders of the OSM community, but a group of GIS students from Foothill College whoe were new to OSM and GIS, who came up from the South Bay, as well as some mapping nerds from San Francisco, and GreenInfo’s executive director Dan Rademacher. We encouraged all to gain the tools necessary to make further Resiliency Maps of their own neighborhoods, and if we see a growth in tagged additions to OSM that note community resources described above, we’ll have been successful in showing their power!
All MaptimeSF meetings use open source tools and are open to the public, and frequently include open hacks, and encourage different ways of using open data. MaptimeSF generally meets the second Tuesday of each month in Oakland or San Francisco. See you at the next meeting!