This a guest blog post by OpenStreetMap community members Lindsey Higgens and Edoardo Neerhut (@eneerhut). Got OpenStreetMap US news or info to share? Hit us up at board@openstreetmap.us and we’ll work with you to craft a blog post to share with the community!
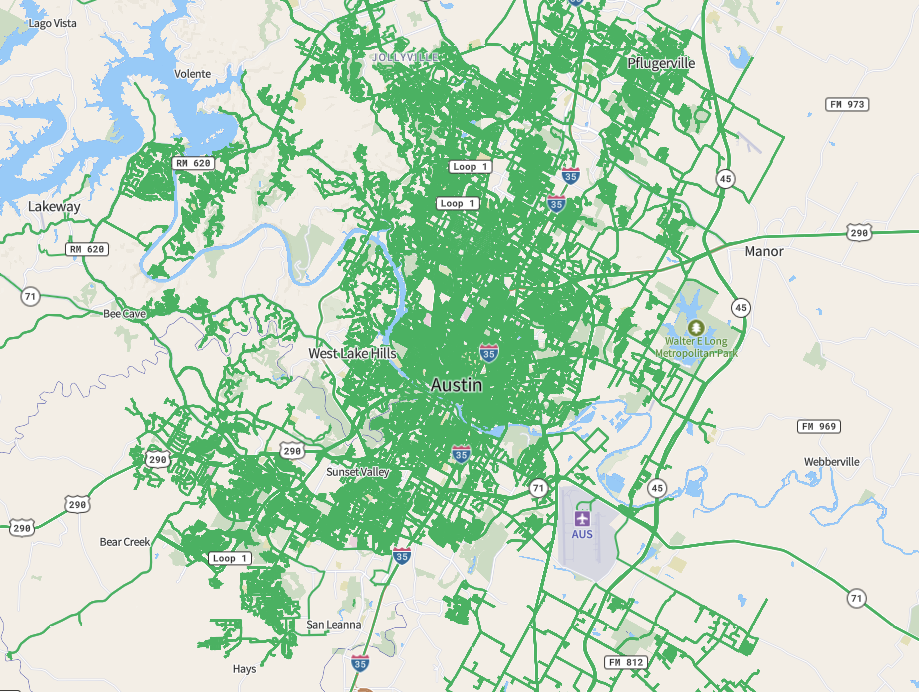
Mapillary coverage over Austin, Texas
In a new mapping challenge, Mapillary is working with the OpenStreetMap community in select locations around the world to help improve map data. In the #mapillary2osm challenge, GeoJSON files for six locations have been made available for anyone interested in using computer vision generated map features to edit OpenStreetMap. For the United States, the challenge city is Austin, Texas.
Why are we doing this?
Editors of OpenStreetMap have longed used street-level imagery to help them add features they might have missed in a field survey. For the last few years Mapillary has tried to improve this experience using Structure from Motion (SfM) to create a better viewing experience and combining this with semantic segmentation to automatically identify objects. A traffic sign layer has been available in iD Editor and JOSM for a while, but Mapillary now identifies a range of map features some of which may be very useful for OpenStreetMap. These point features as we call them are objects that have been identified and given an estimated latitude and longitude. Some features such as traffic cones are rather dynamic and less relevant for OpenStreetMap, but others such as fire hydrants, bicycle parking, and phone booths are all features that can be added to the map. The #mapillary2osm initiative is an opportunity for us to learn how useful and/or accurate different features are and how mappers integrate them into their workflow.
How it works
Mapillary has provided GeoJSON files with the locations of benches, mailboxes, and trash cans with each file representing an area of 9 square kilometers. The locations of these map features have been automatically detected using computer vision from street-level images captured in Austin. Community members are also encouraged to collect more imagery during the challenge as there is the possibility to request new downloads of the data—allowing groups to capture new streets or improve the quality of imagery if a particular feature has not been picked up in that area.
The quality and quantity of detections will vary between each of the participating locations, but you can help to improve the accuracy by capturing high quality images in your area. This will increase the chance of an object being identified but also provide an opportunity for more training data in future.
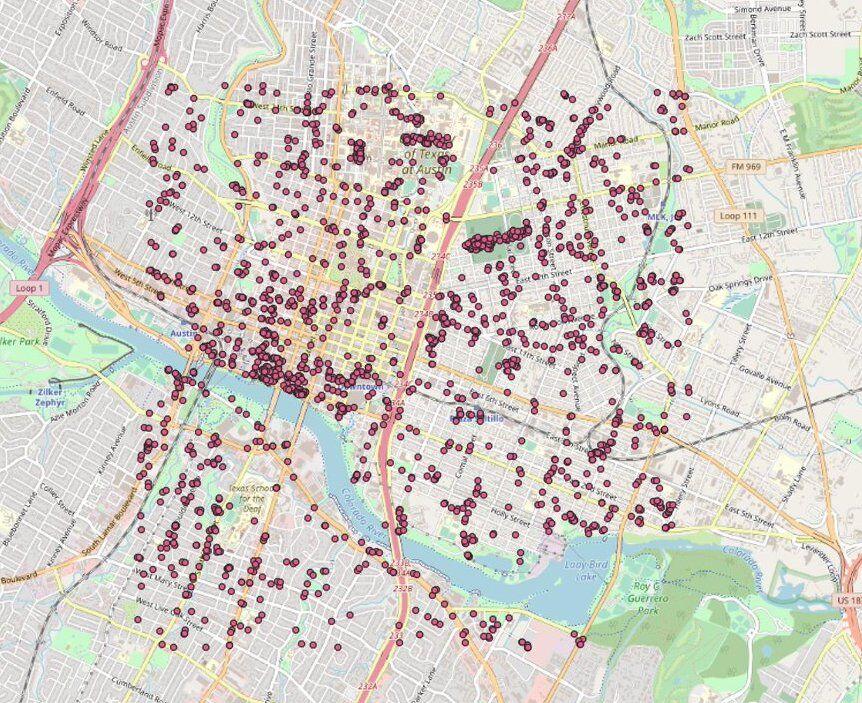
The locations of benches in Austin that were automatically detected by Mapillary
Each changeset will need to have #mapillary2osm in the comments to help inform us when an edit is linked to the competition. Edits will be tracked on this leaderboard and ranked according to the number of relevant nodes added by each username. At the end of the challenge, Mapillary will award prizes to the top participants in the most active area.
The other challenge cities are Antwerp, Ballerup, Kyiv, Melbourne, and São Paulo—so if you have friends in any of those areas, spread the word.
Challenge Structure
-
Take a look at your zone: 25 square kilometre zones have been created around each of the lat/lons that were put forward by each community group. This should be enough to get a decent number of point features, but also an area that can be completed to 100% for the derived features.
-
Download map features: Find the map feature data for your area and download it. The map features are provided as a GeoJSON file and can be viewed in iD Editor by going to ‘Map Data’ on the sidebar and then loading the GeoJSON file where it says ‘Custom Map Data’. You will see the detections as pink circles on the map. Use the Mapillary street-level imagery layer to see which images the map features have been detected in.
The map features contained in the GeoJSON are provided under the ODbL license and may not be used for any purpose other than OpenStreetMap editing.
- Edit the map:
- Take a look at the detected feature and the image it was detected in. If it’s not on the map, add it!
- Edits should be creating one of the following objects:
- Add the hashtag #mapillary2osm to the changeset so that we can link these edits to the #mapillary2osm challenge.
- If you are a relatively new mapper, select ‘I would like someone to review my edits’ when saving the changeset. If it looks like each location will complete all map edits well before the end of the challenge, we may release other map feature data. These will appear in the same folders.
- Capture more imagery: Contributors can capture more imagery in the target area and request new map feature data 3 times during the competition. This is 3 requests per location, not per individual, so coordinate as a team to make sure you capture imagery and request map data at the right times. Requests to be sent to me as a private message.
The leaderboard will update a few hours after you make the edits with the total reflecting the sum of nodes created that have one of the three tags.
The #mapillary2osm challenge ends May 16th at 23:59 UTC. For more information, see the original post on the Mapillary forum.
Happy mapping!
Interested in contributing a blog post? Let us know!