From October to December 2019, OpenStreetMap US asked folks to participate in a community survey to help provide a baseline from which to measure our growth and input to help shape the future of the organization.
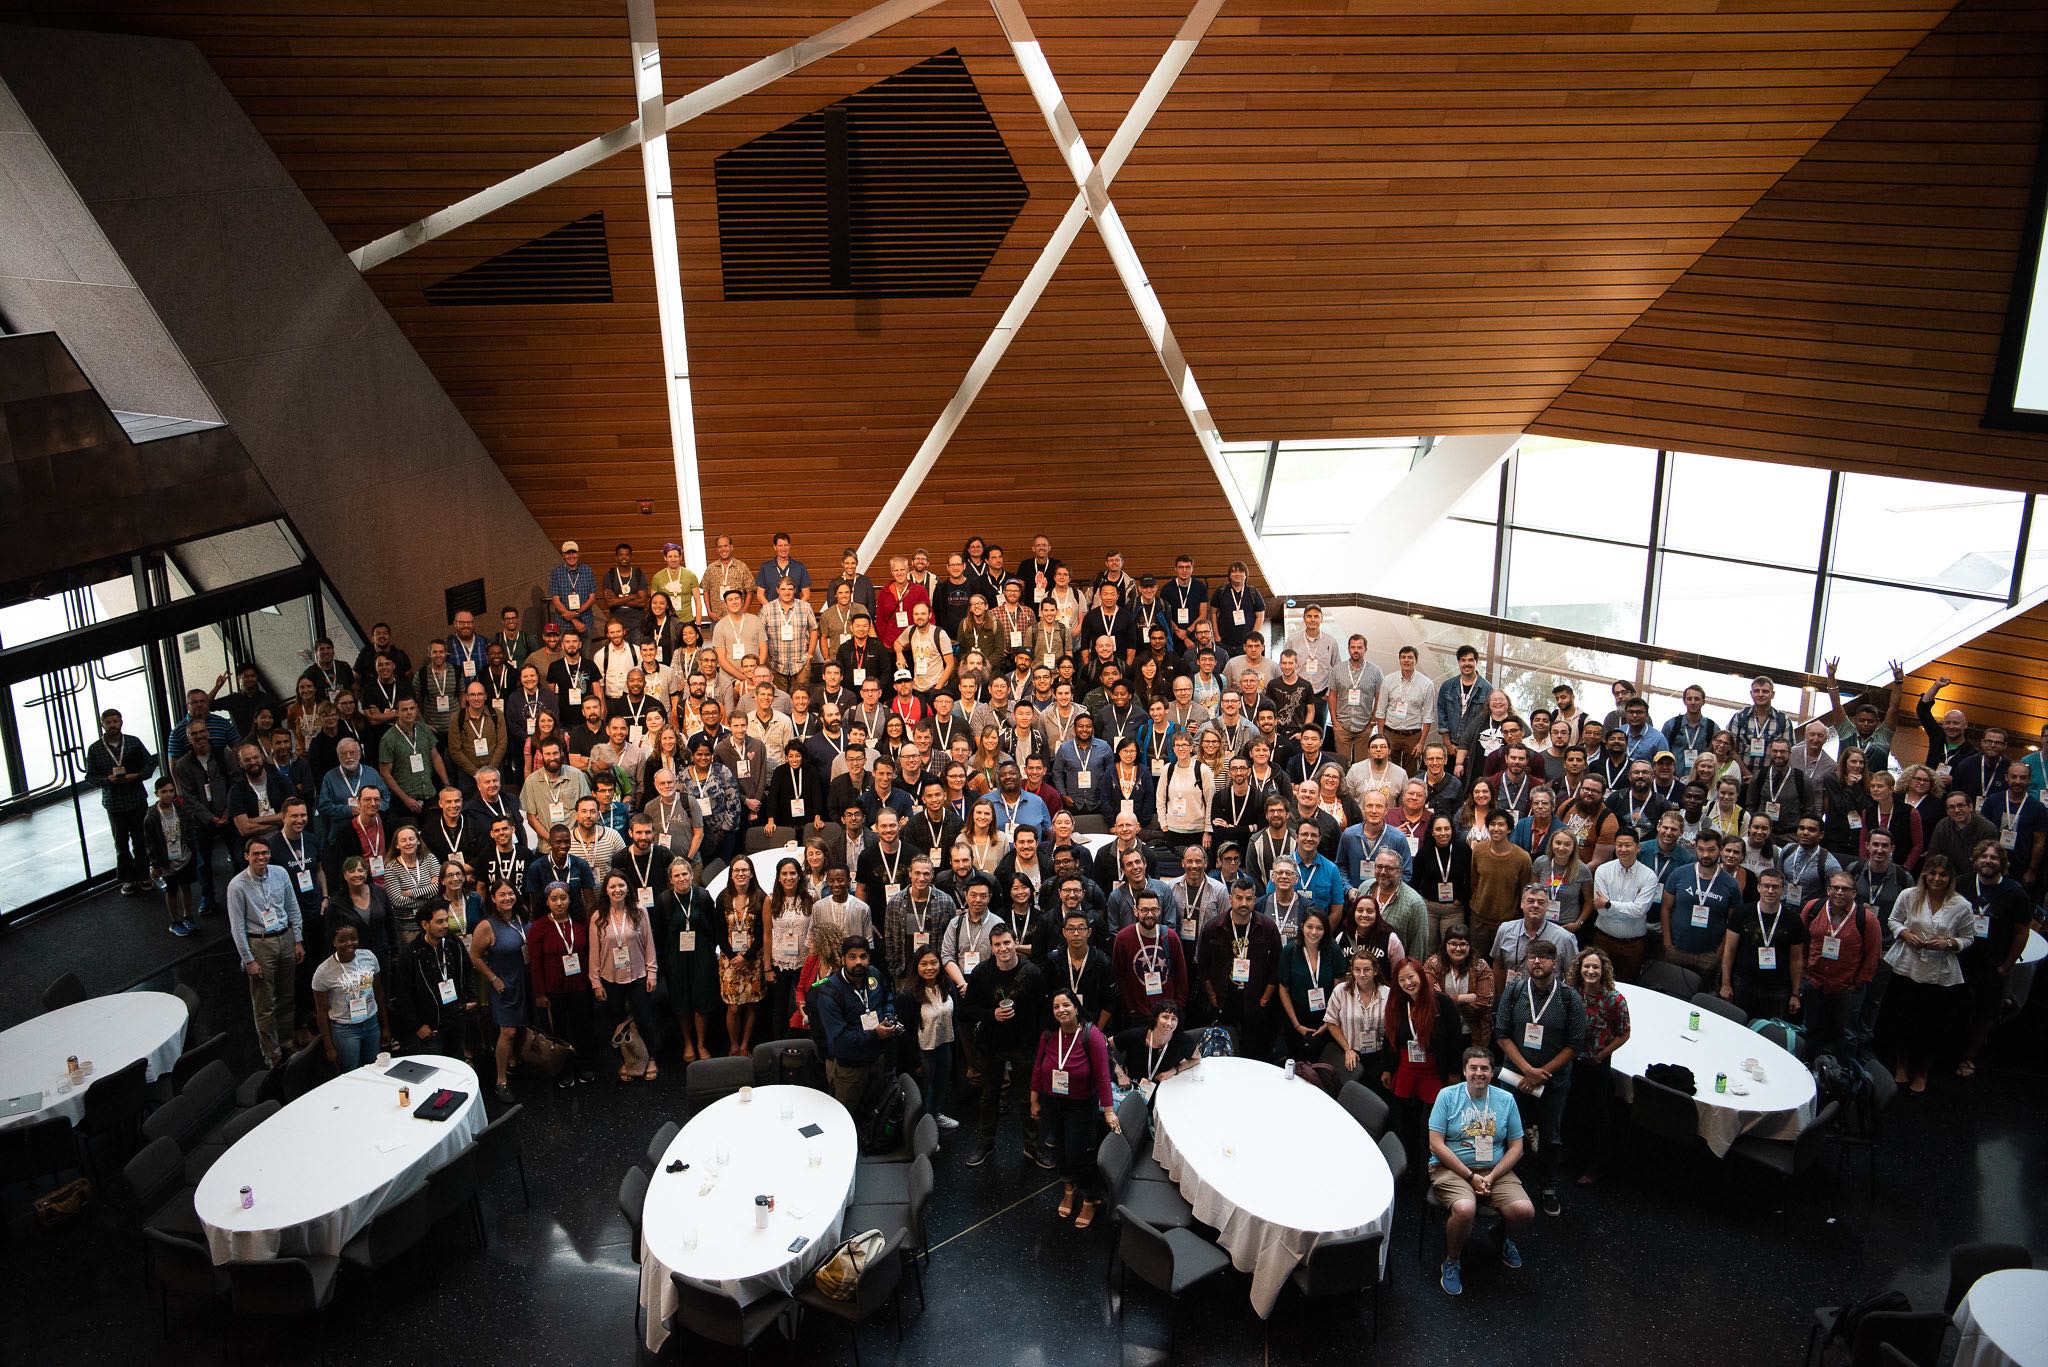
Thank you to all those who participated! The responses received are fantastic and inspiring. They include information and opinions from approximately 130 community members including program priorities, ways OpenStreetMap US can better grow & support our community, data on what tools people are using, our community demographics, and more.
Given the richness of these survey responses, we’ve decided to put together a series of posts highlighting a number of different themes. This first report provides an overview of the quantitative results and a roadmap of what is to come. We hope you will find these answers as helpful and exciting as we do!
1. Demographics
Who responded to the survey?
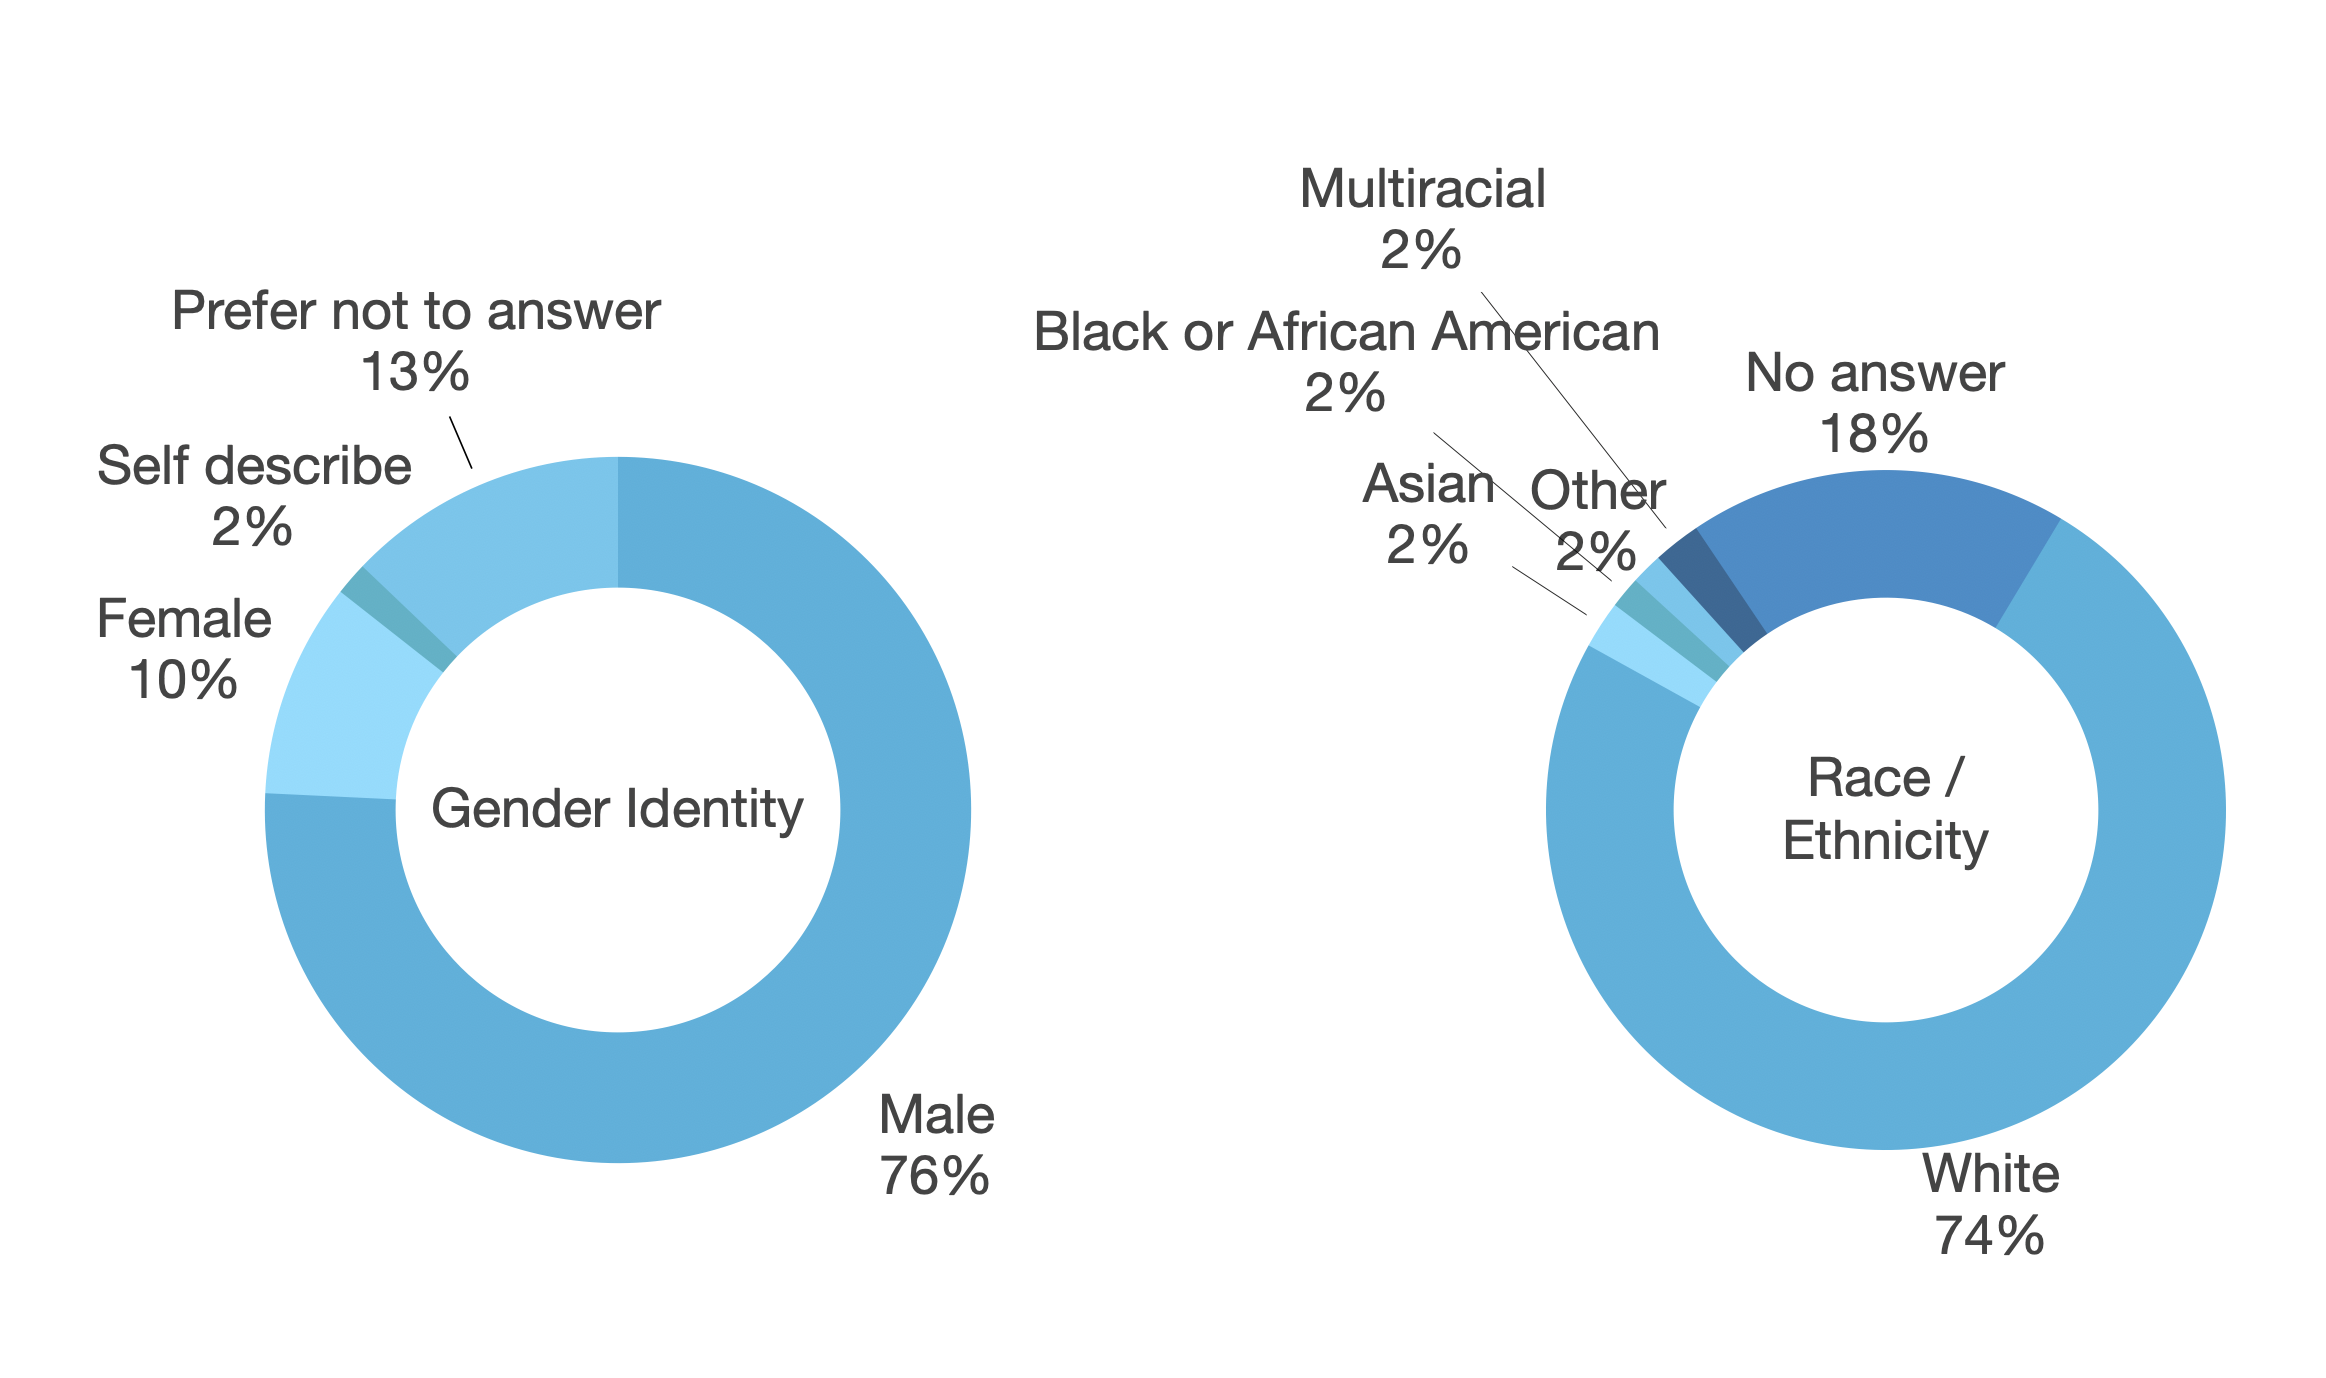
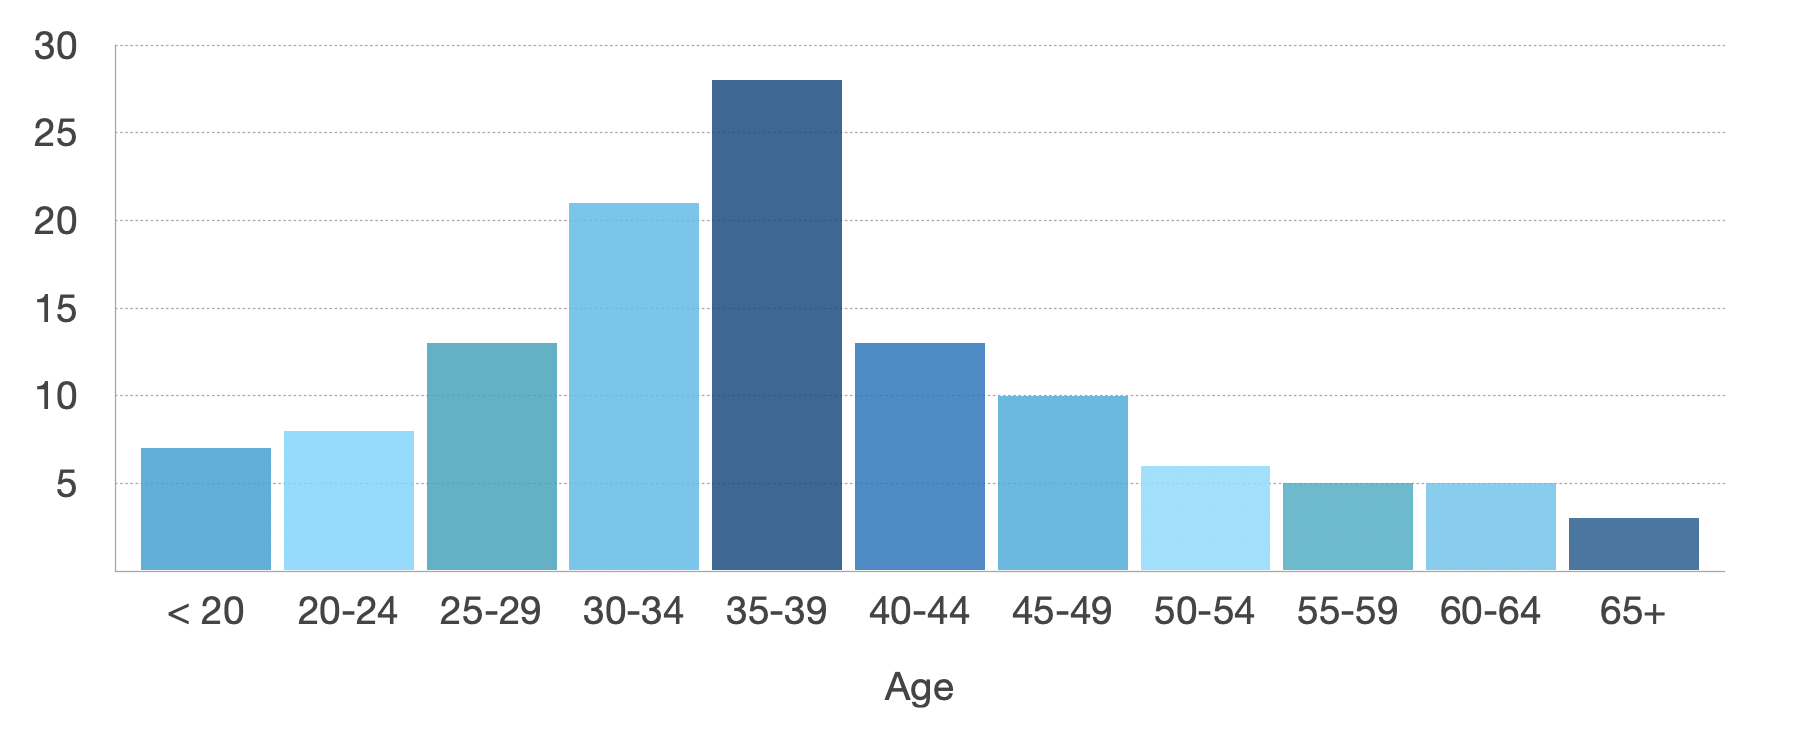
The majority of those who responded were white (74%) and male (76%). Approximately 54% of respondents were between the ages of 30 and 44.
While OpenStreetMap US acknowledges that much of our community identifies with this demographic, we believe that there are more folks out there who did not have a chance to complete the survey. We have decided to reopen the survey for a few more weeks and invite additional participation at this time! osmus.wufoo.com/forms/m1tozhbo14neo5d/
2. Mapping
We counted 5.7M features that were last edited by one of the 107 respondents that provided their OSM username in the survey. Here is a map of where those features are:

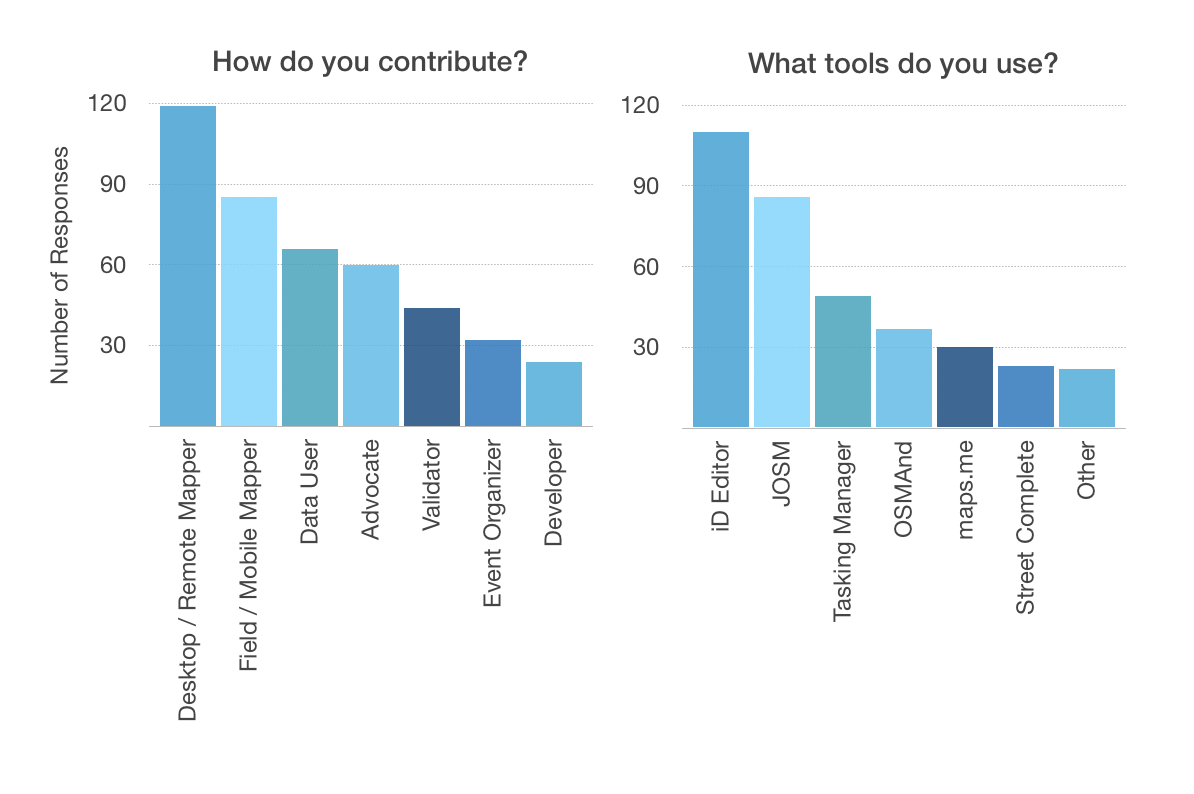
When it comes to tools and mapping preferences, we see see that iD is the most common editor, followed closely by JOSM (below). Answers for “Other” tools included: Maproulette, Mapillary, OpenMapKit, RapID, OSMGo!, ArcGIS, Pic4Review, uMap, Inkatlas, HOT Export Tool Guru maps, and Deriviste
When asked what and where people liked to map, roads were the most preferred, then buildings, then points-of-interest. In terms of where folks are mapping, there is an emphasis on adding and fixing local information on the map, mapping travel destinations, and humanitarian mapping tasks.
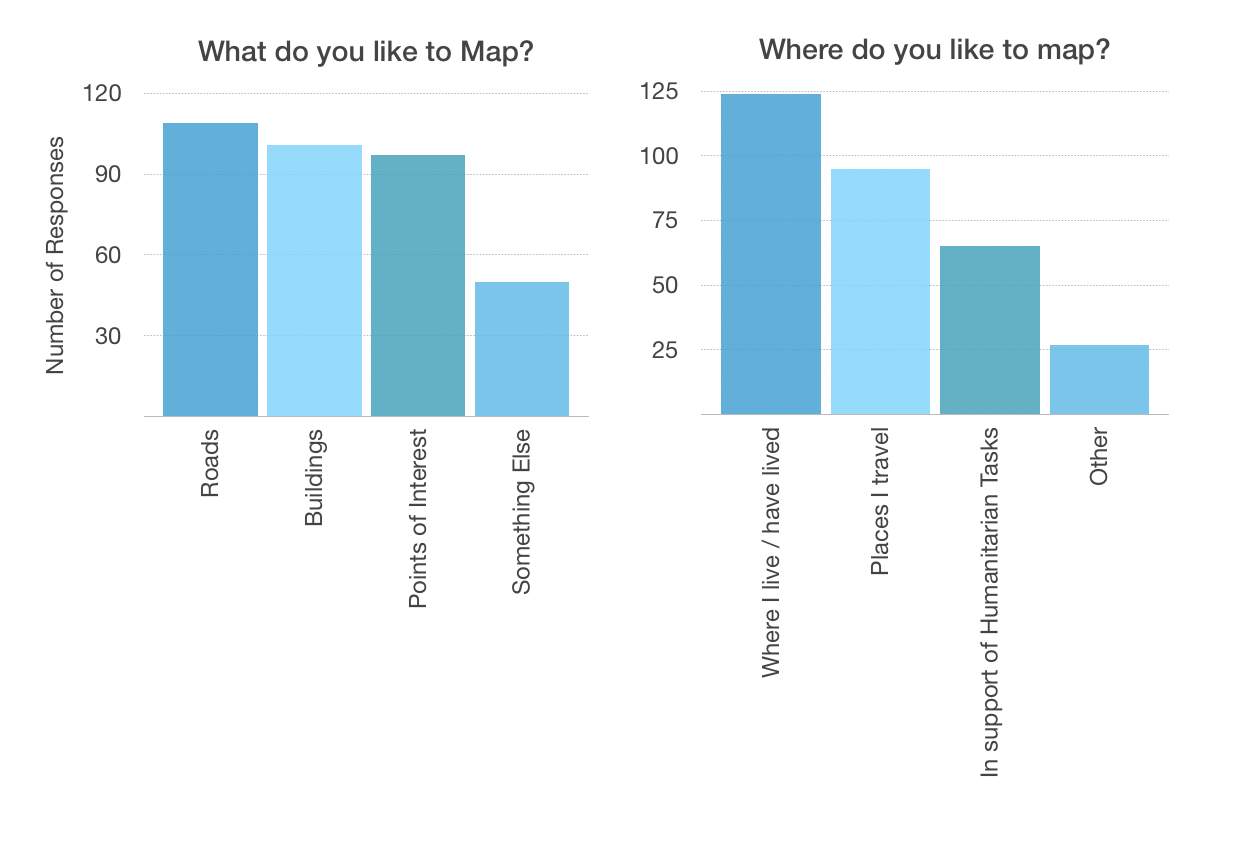
Other locations for mapping included: Map Roulette and non-humanitarian-related tasks, unexplored parts of one’s home state or the counties next-door, projects posted by the Department of Transportation (DOT), work-related editing, places people hope to visit / explore a different landscape, generally where the map was low quality / low density, and anywhere the map needs help or cleanup, especially TIGER.
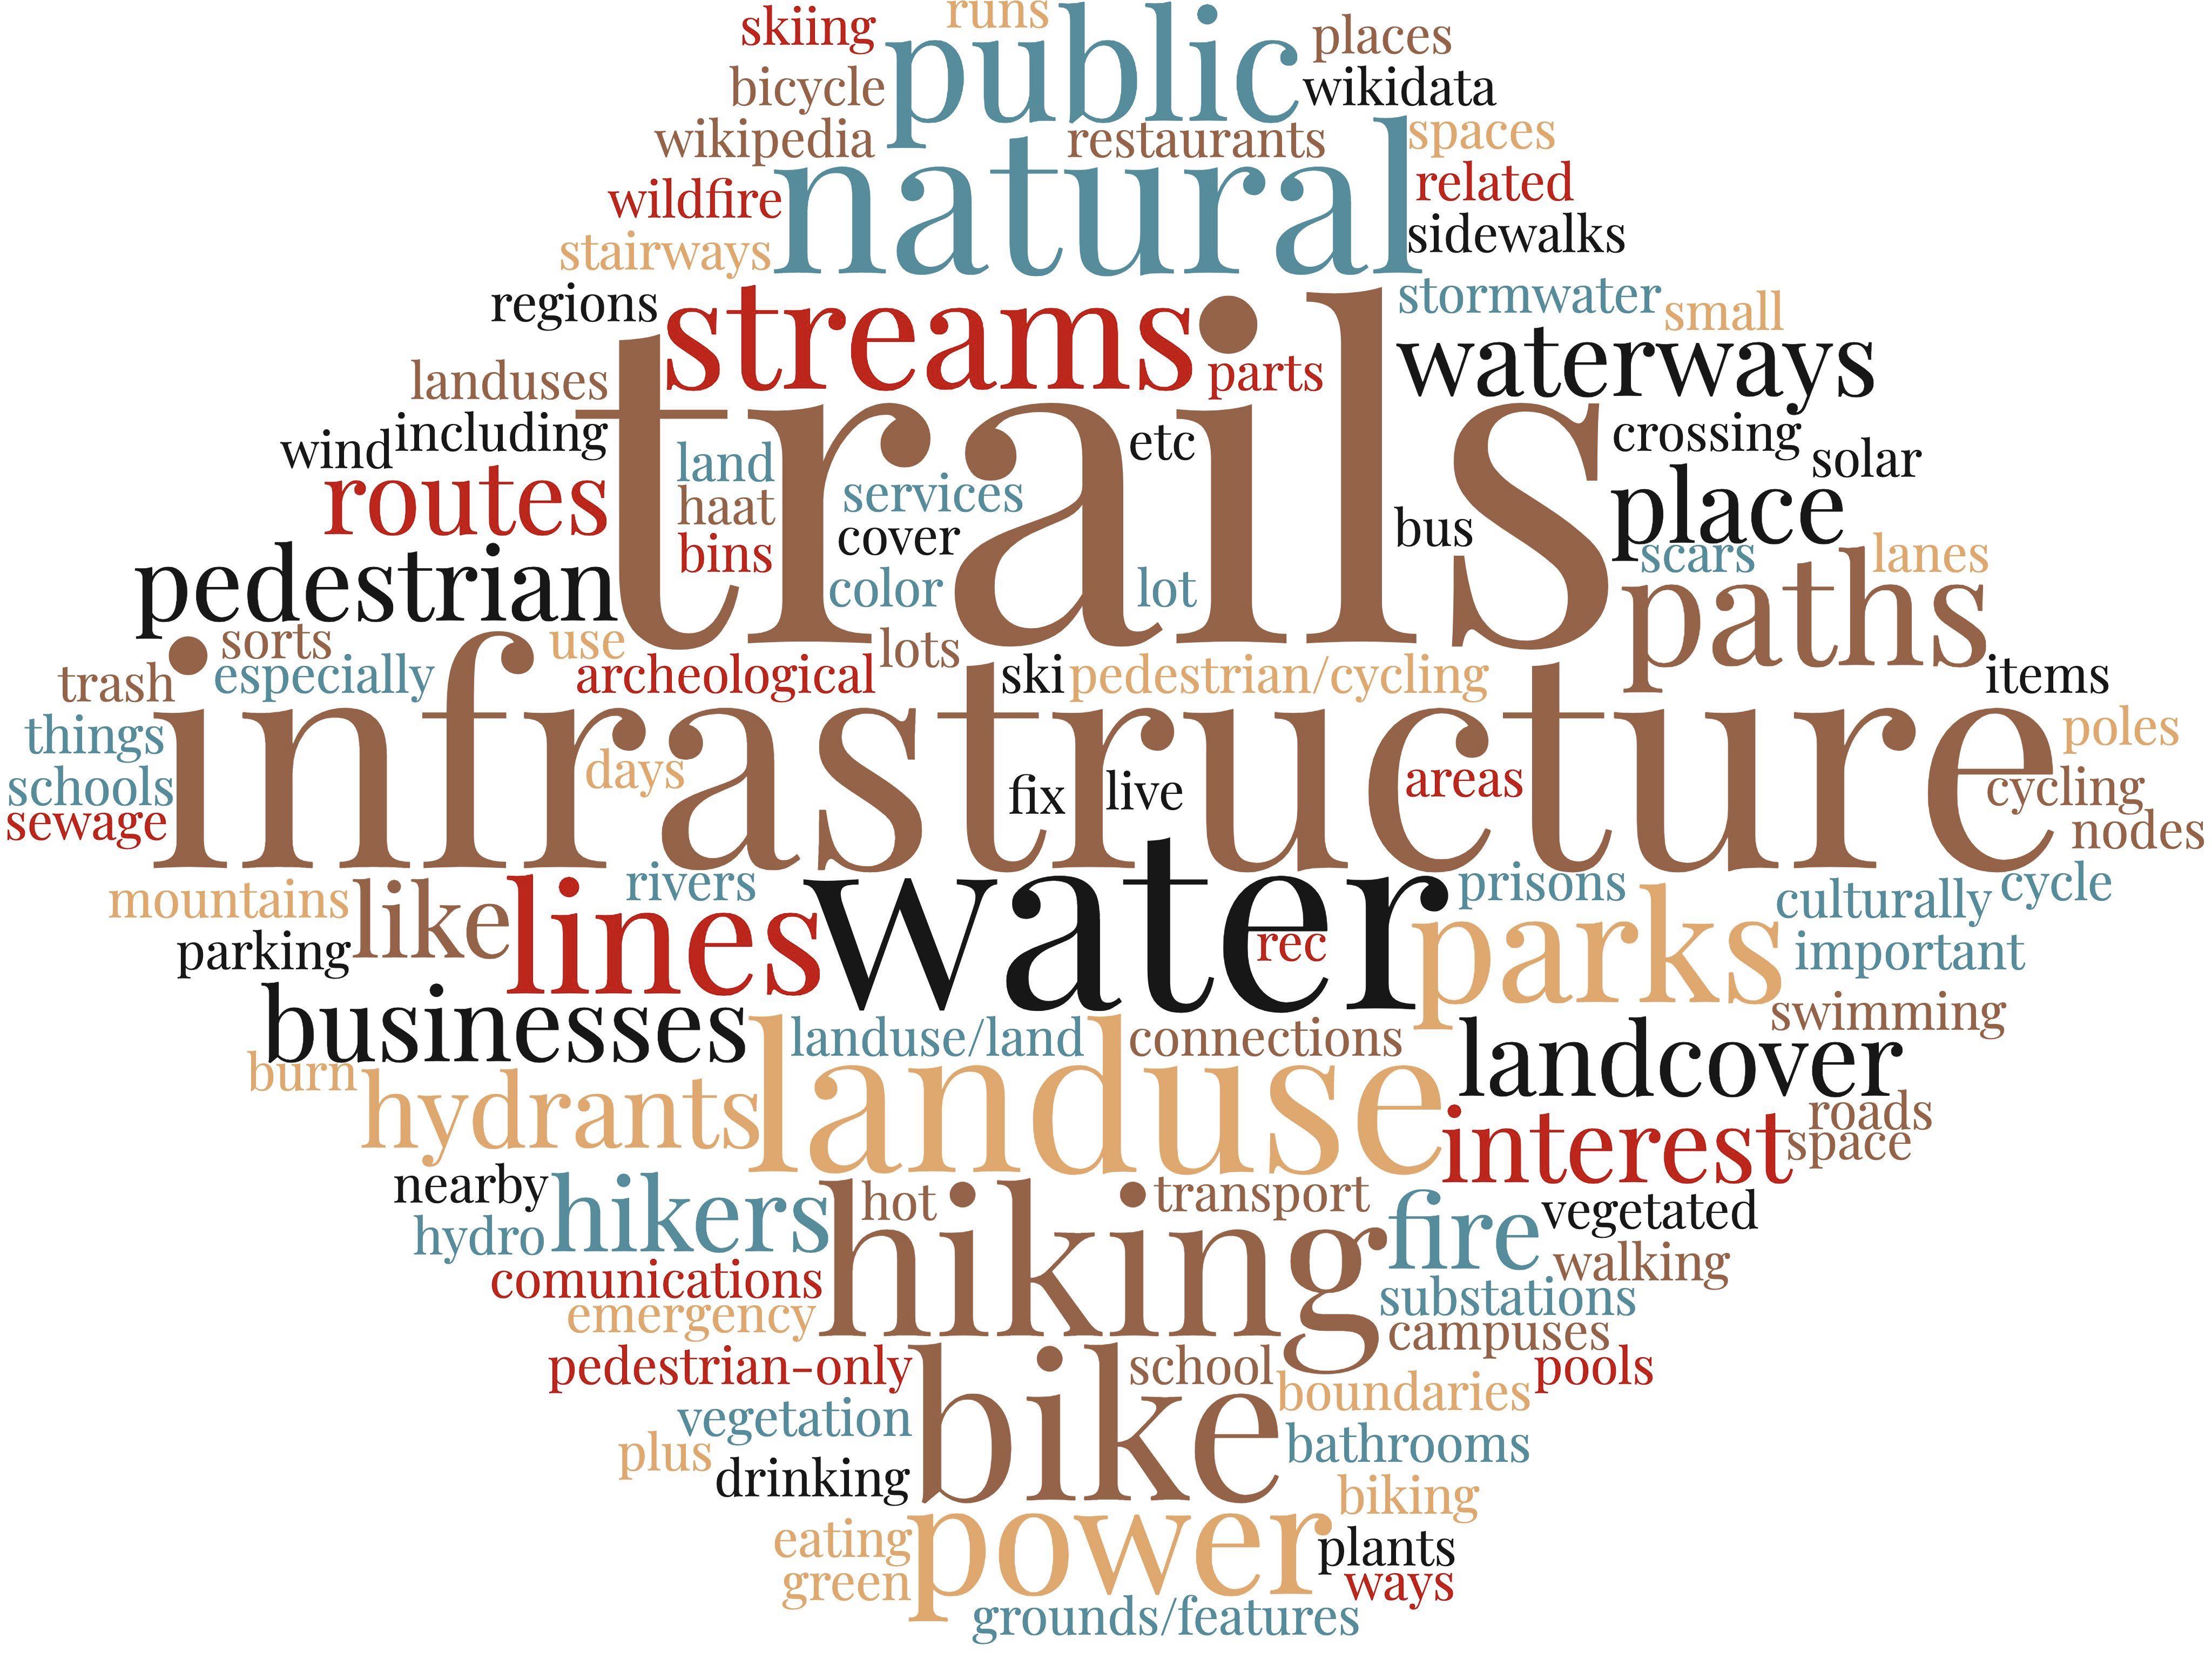
We received a number of responses to “Something else” visualized here in a wordcloud:
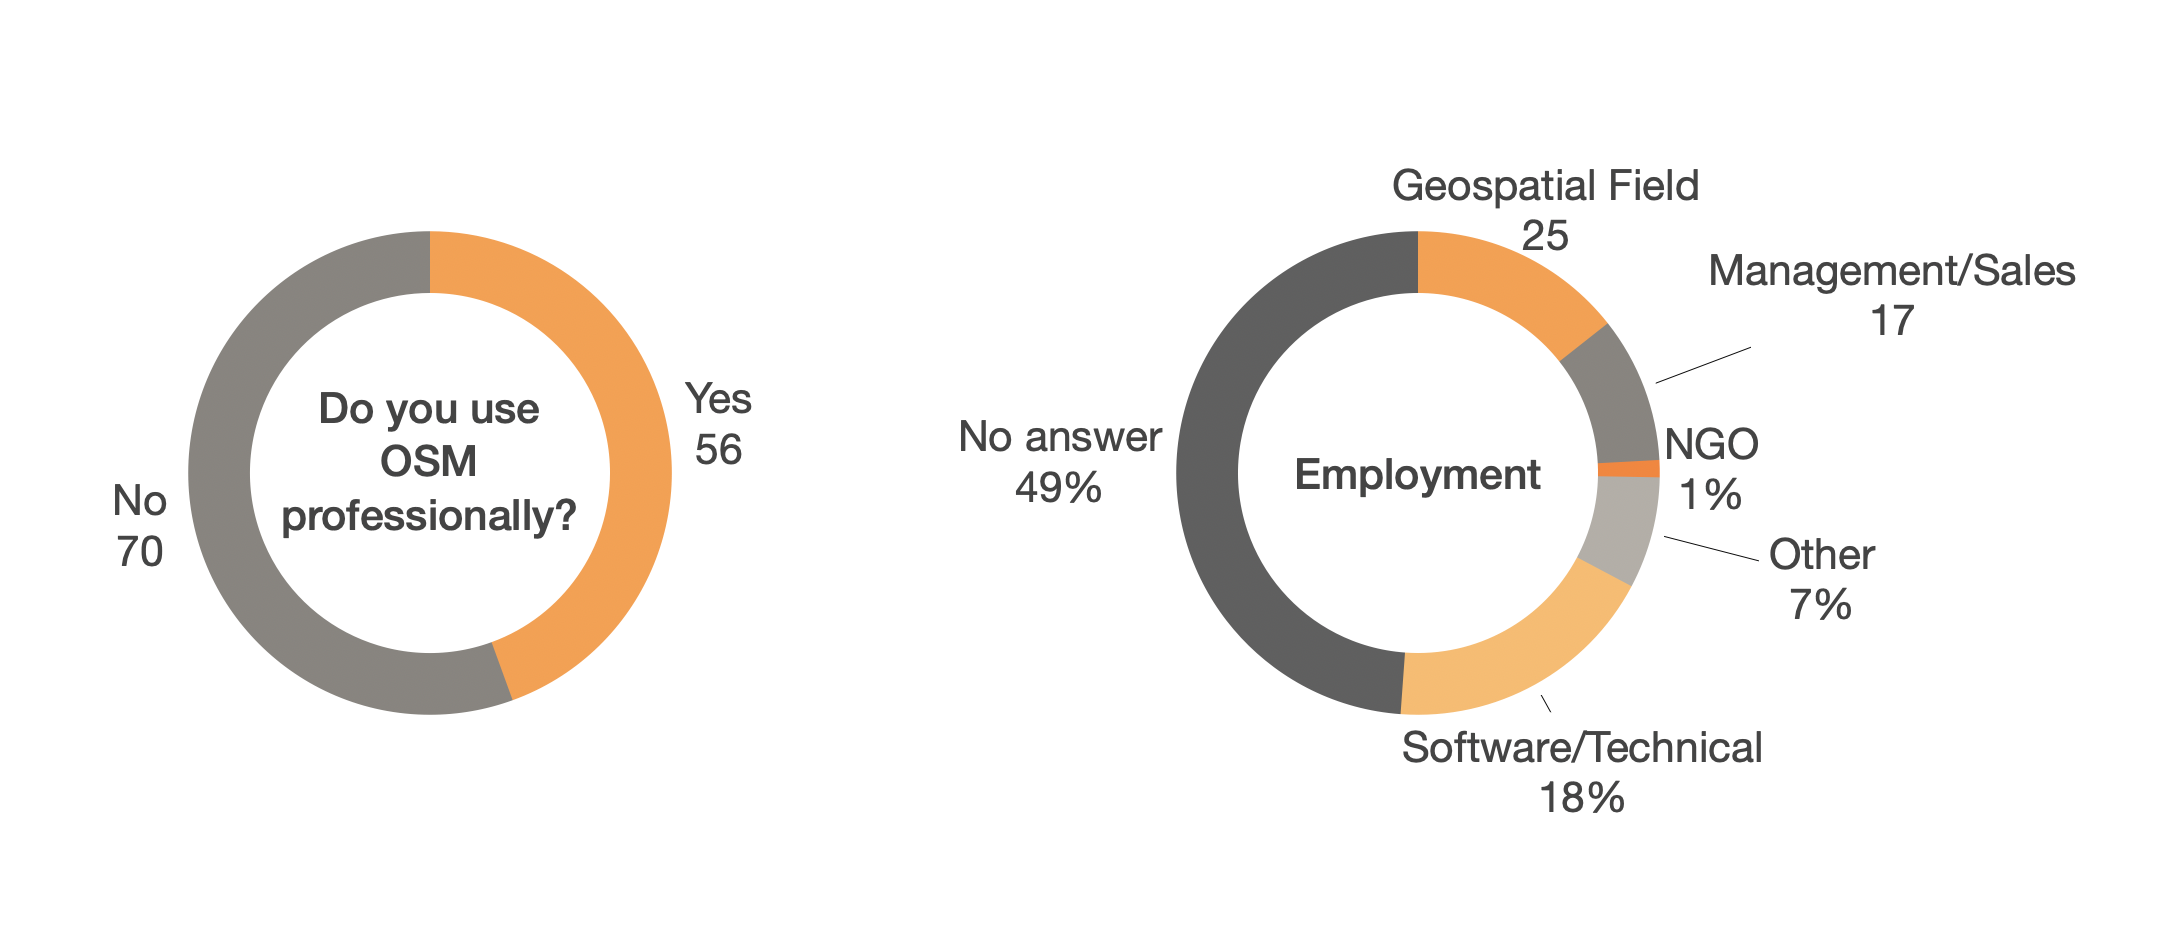
When asked their occupation, nearly 2/3s of respondents provided an answer revealing that 32 are in a software/technical field and 25 respondents work in geospatial or GIS. In terms of using OSM professionally, 56 respondents said yes.
3. Community
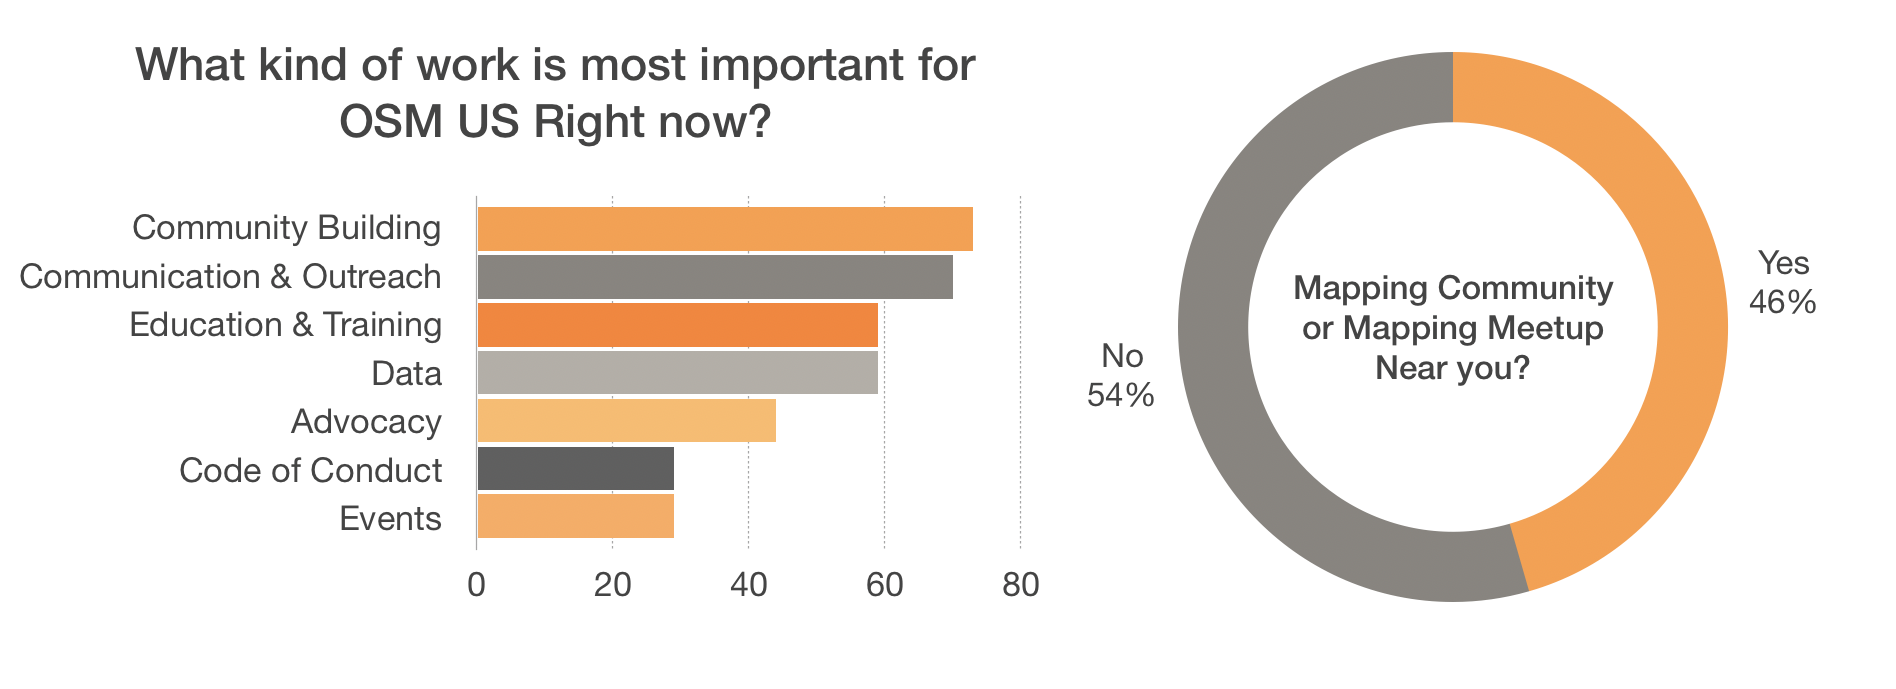
A primary goal of this community survey is to learn what OpenStreetMap US can do to grow and empower our mapping community. Respondents agreed, ranking community-building and communication as the top upcoming priorities for OpenStreetMap US, with education a close third. Additionally, just under half of respondents reported a mapping community or meetup near them, establishing a 2020-baseline from which we can grow.
To learn more about the community, the survey included many open-ended questions to help us better understand why folks started mapping in the first place and what keeps them engaged. Here are a few of these phenomenal responses:
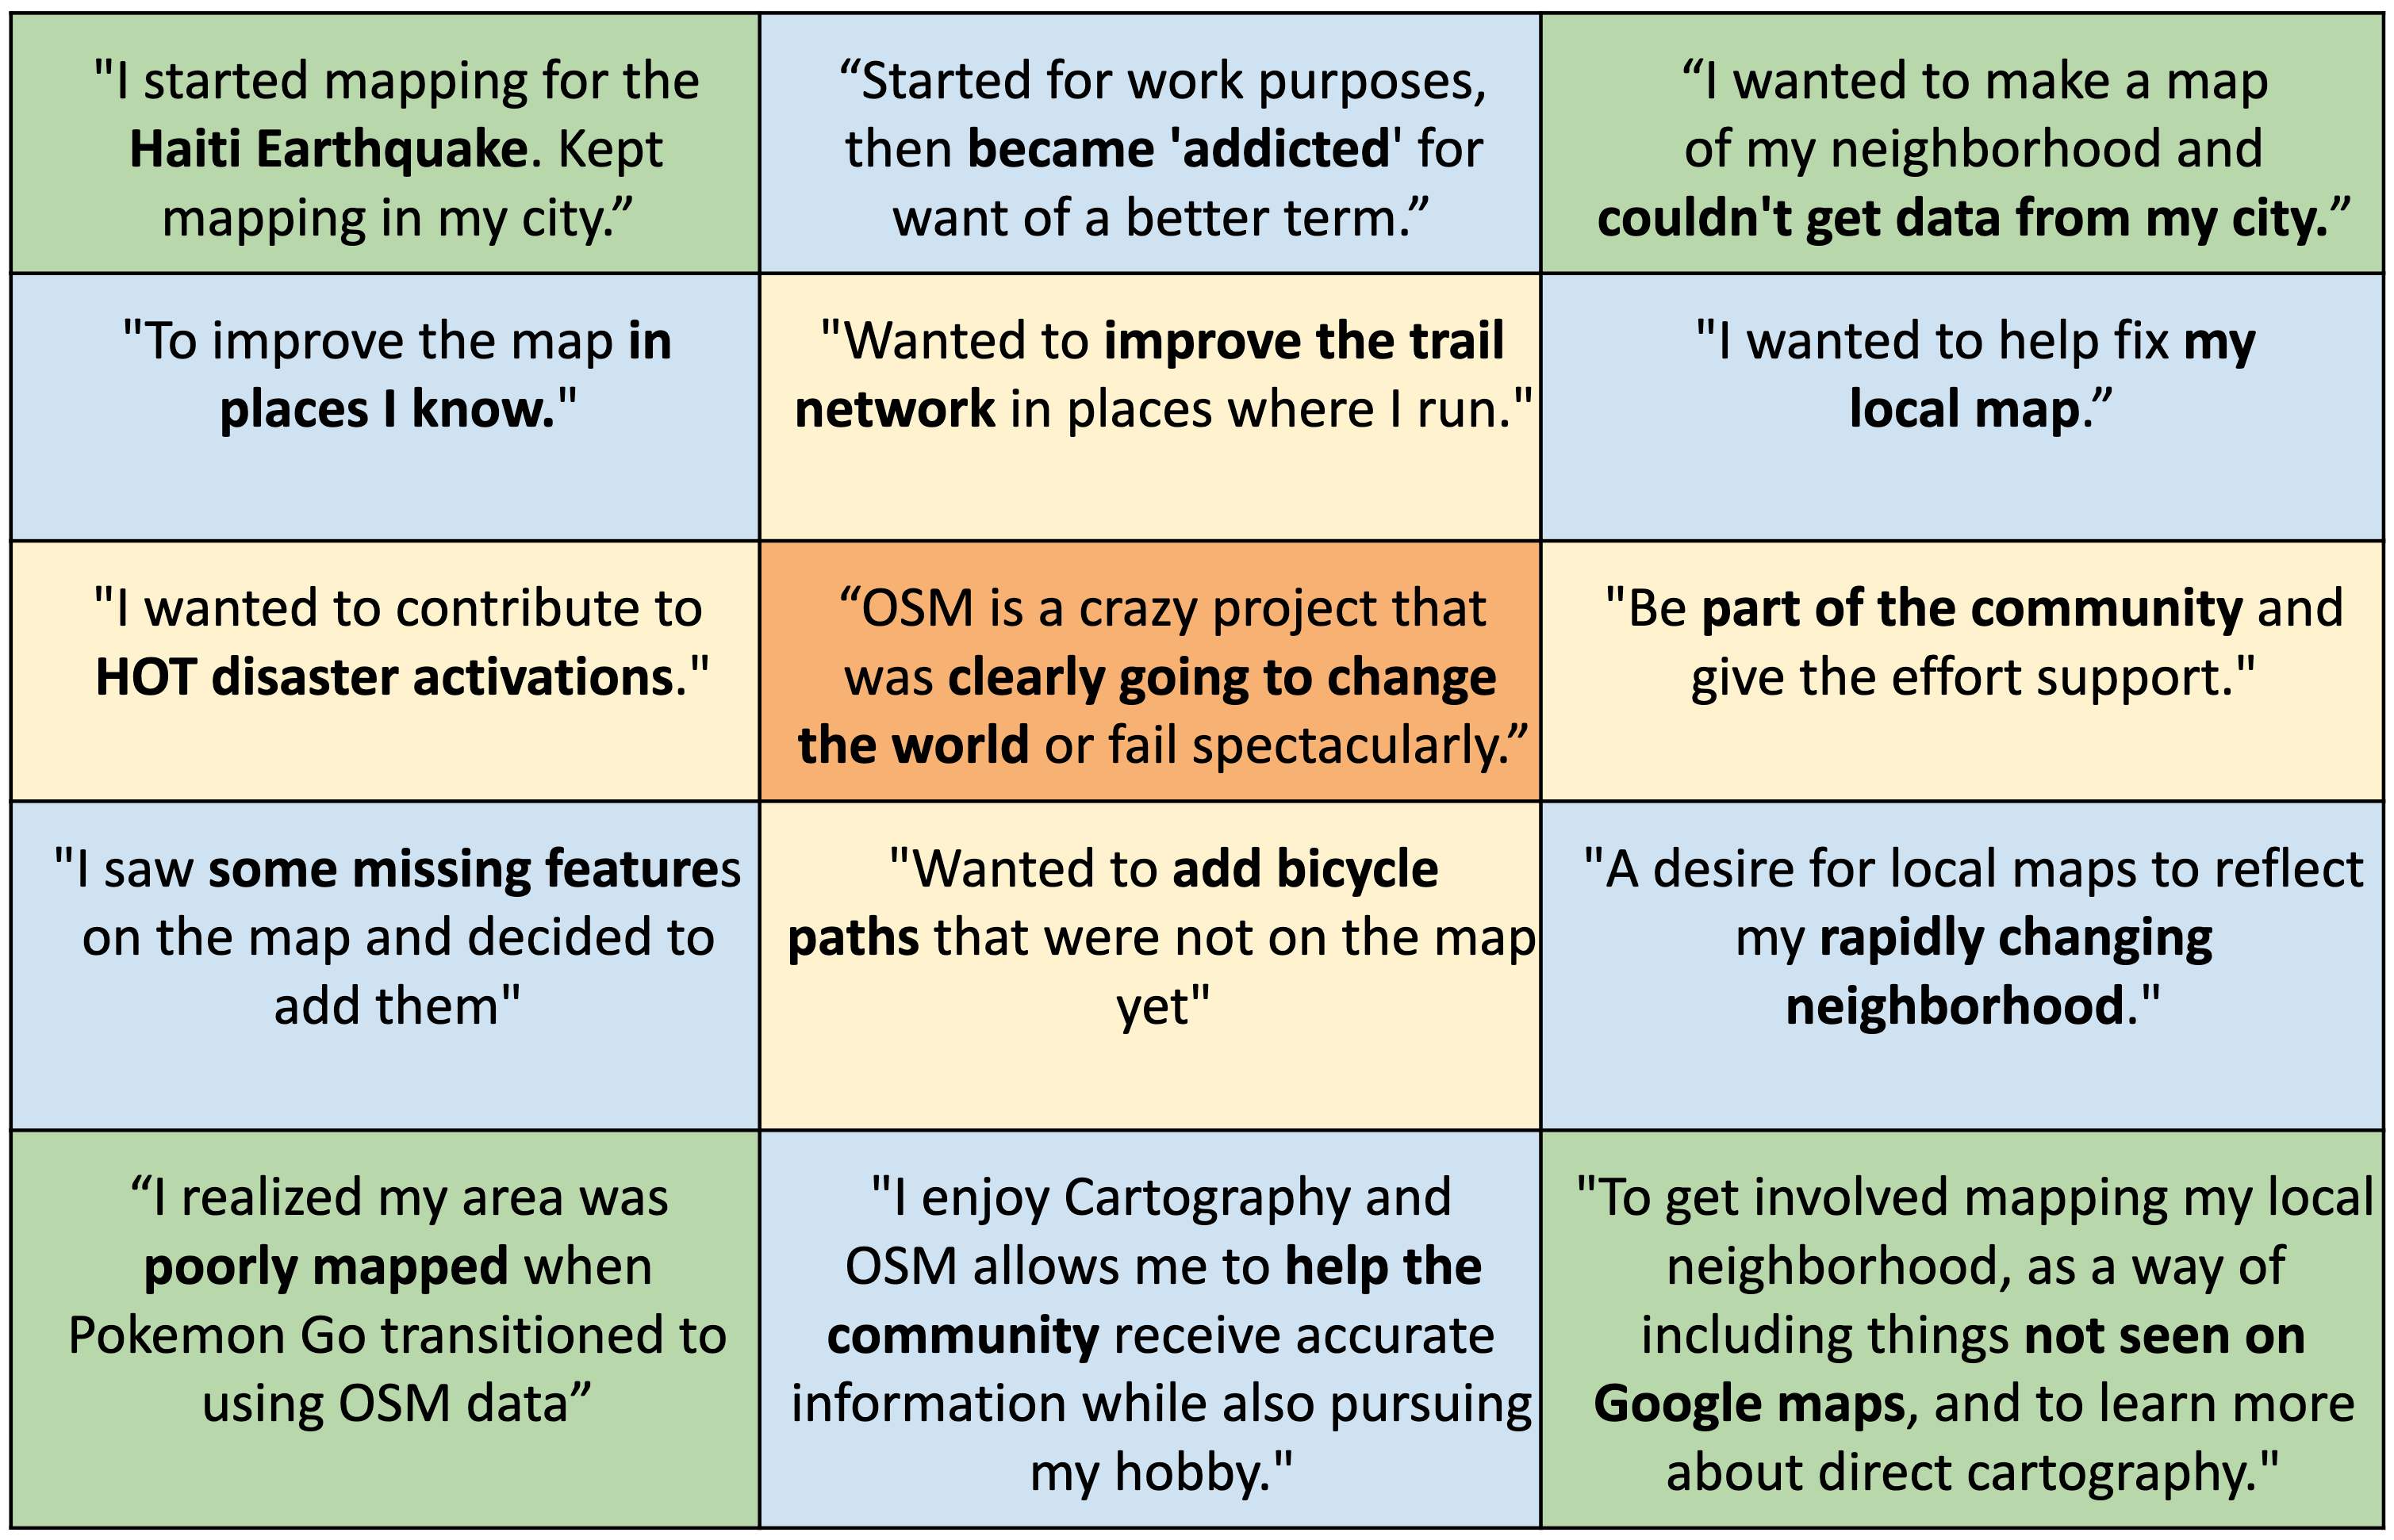
An initial review of the survey results have identified a few underlying themes present in our community. In an effort to share additional insights and highlight these themes, we will be releasing subsequent blog posts around topics such as transportation, local data, community, and more. If you are interested in helping put together these posts (and maybe even helping design a talk at SOTMUS 2020 around one of these topics!), please get in touch, we’d love to collaborate.
Again, if you did not fill out the survey in Fall 2019, please consider taking a moment now to share your ideas. The survey has been re-opened so your responses can still be included and everyone can be counted! Fill out the community survey here