The 12 Months of OpenStreetMap is an initiative led by OpenStreetMap US, and inspired by the Project of the Month done by map contributors in France, Switzerland, and Germany. The initiative is designed to engage the mapping community and volunteers around a new theme every month.
Mapping buildings is one of the main gateways for new mappers into OpenStreetMap. Whether mapping your own house or completing a project on the Tasking Manager, there is a strong chance that you have contributed at least one building to OSM. Mapping buildings, and other aspects of the built environment, have a wide range of applications. Mapping buildings, roads, parking lots, and other impermeable surfaces can help us assess population growth and movement, calculate the impacts of Urban Heat Island effect in our cities, and understand where populations are at risk for the impacts of climate change such as sea level rise.
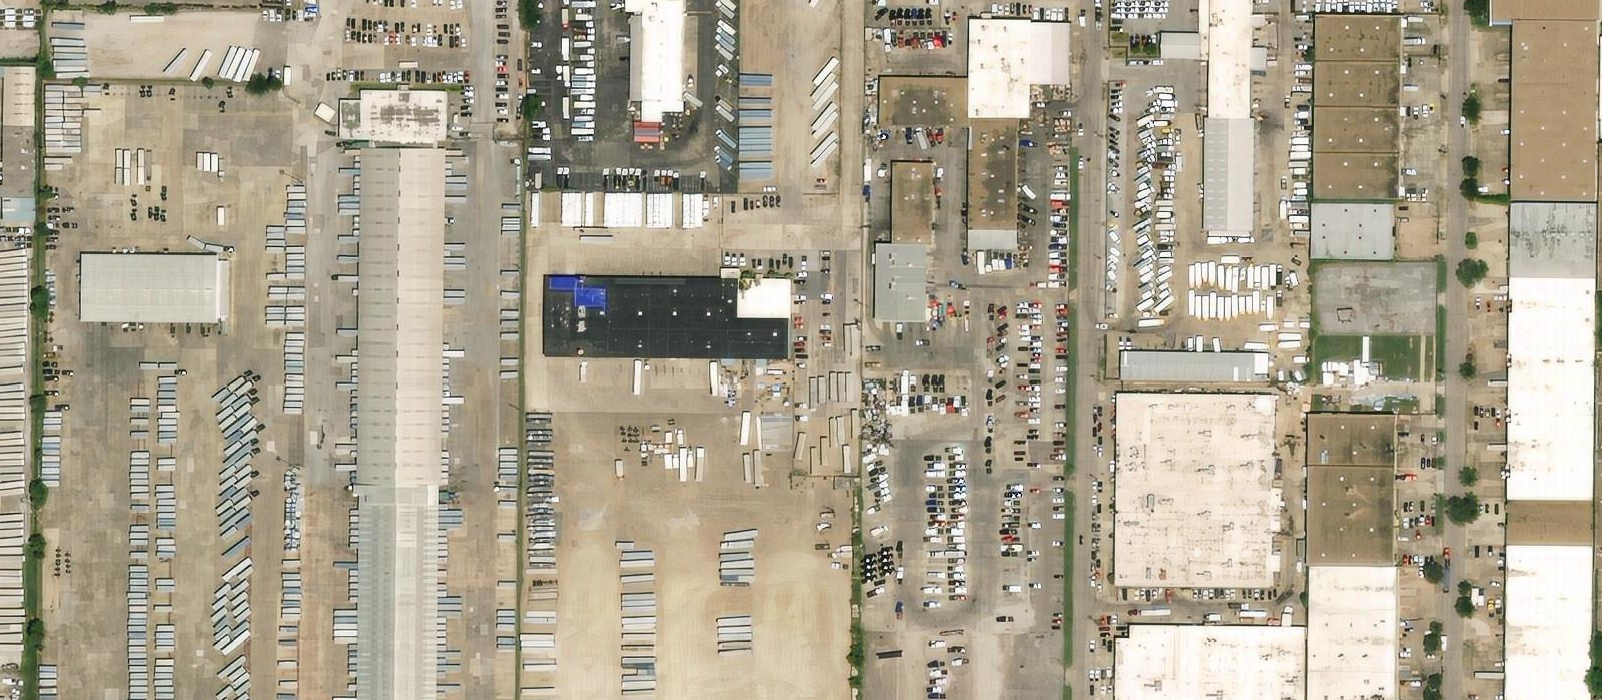
Even though buildings are some of the most common features to be mapped in OpenStreetMap, there are still significant gaps in data across the United States. This month, we’re encouraging mappers across the community to help close those data gaps by mapping buildings, roads, parking lots, and other aspects of the built environment.
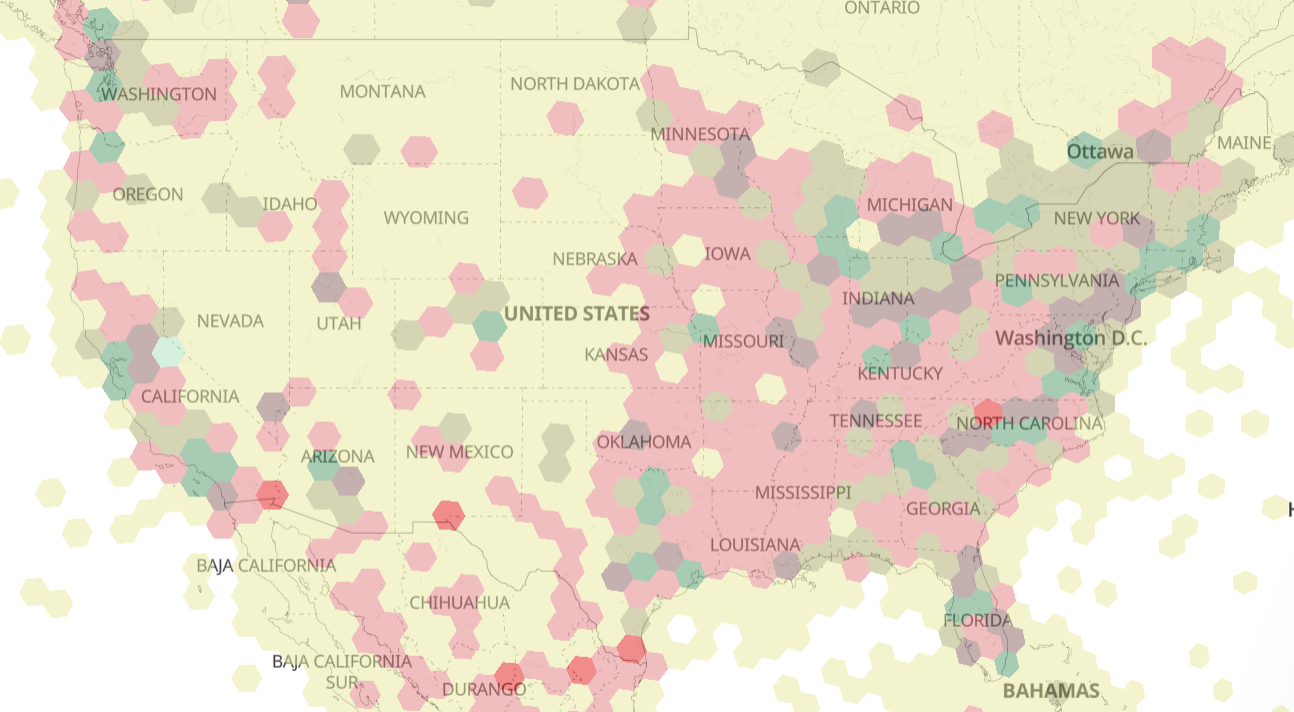
OSM Building coverage in the United States. Red areas have an estimated low coverage compared to population. Image Credit: KONTOUR
What you can map
Use this brief guide to get started and what resources to use. Be sure to add #12MonthsofOSM to your changesets in March.
1. Remotely map buildings in your local area or neighborhood.
Try to map a minimum of 25 buildings. If all the buildings are completely mapped in your local area, look for a nearby neighborhood that is incomplete. Consider focusing on under-served neighborhoods in your city.
To map buildings, trace the outline of the building footprint as close to the building edges as feasible. Tag the area feature with building=yes. Always use the building=yes tag UNLESS you can verify through local knowledge that the building is something more specific such as a school or fire station. More information can be found on the OSM Wiki here.
2. Add building heights to mapped buildings in your area.
Building height information is critical to additional analysis such as flood and earthquake impact, population assessments (particularly for health and disaster services), and damage assessments.
For buildings that you are familiar with from local knowledge, add building:levels=* (ex. building:levels=2 for a building with two storeys above ground). More information can be found on the OSM Wiki here.
This is not a remote mapping task. Mappers are encouraged to either collect this information in-person (i.e. field survey) or use local knowledge.
3. Map parking lots in your local area or neighborhood
The number of parking lots in your vicinity depends on the ratio of residential properties to amenities and commercial services. At a minimum, try to map a minimum of 5 parking lots. More information can be found on the OSM Wiki here.
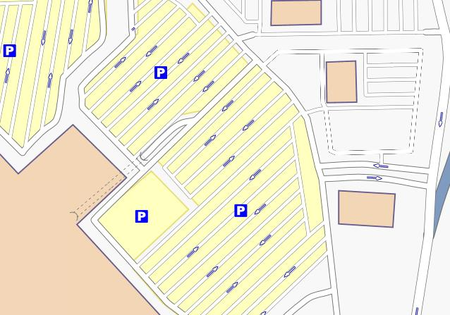
Example of parking lot mapping in OpenStreetMap from the OSM Wiki
Monthly Project
Each month in 2022, we’ll highlight (or set up) a project for the OpenStreetMap US community to gather around and map. This month, help improve OpenStreetMap data on impervious surfaces for climate change analysis and urban resiliency by mapping parking lots in the New Orleans urban area. In 2021, New Orleans was rated as the US city with the highest urban heat island index. Buildings, roads, parking lots, and other impervious surfaces are major contributors to Urban Heat Island effect.
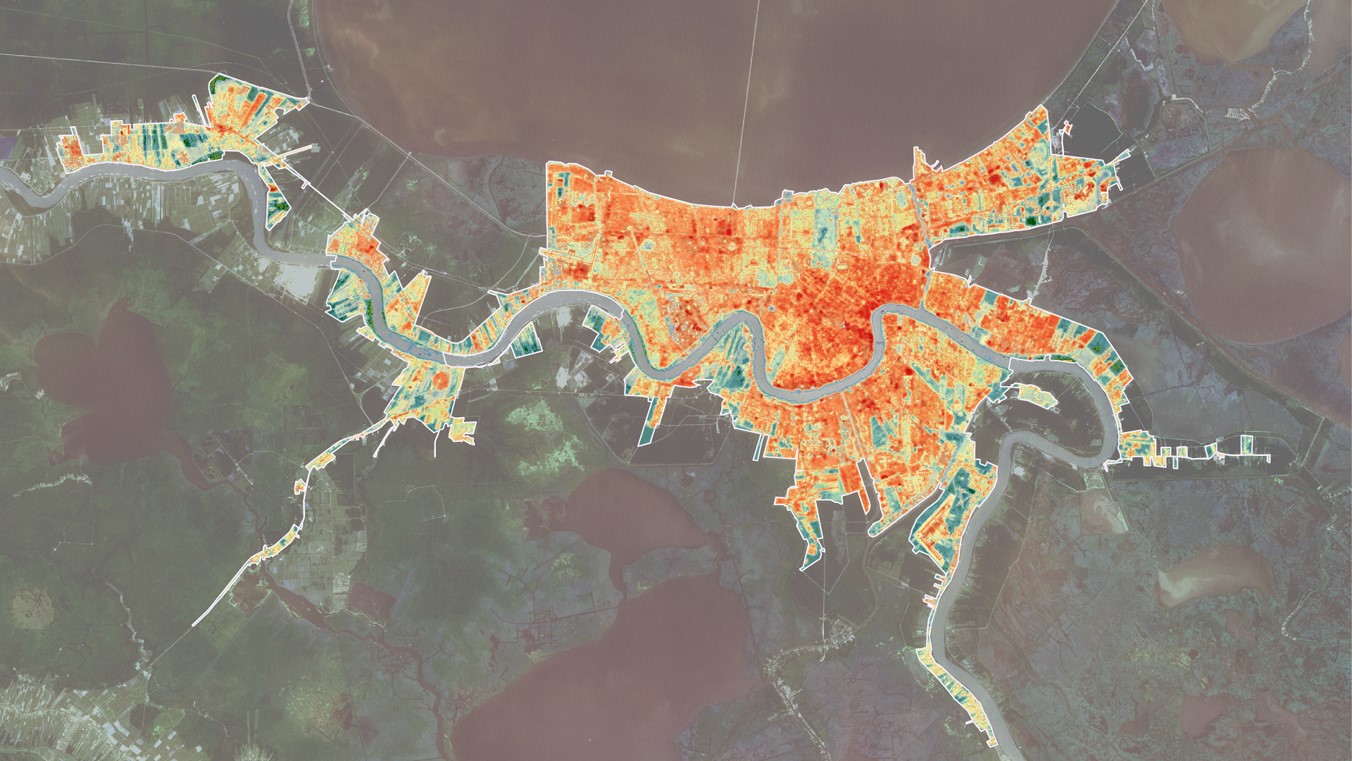
Land surface temperature map of the New Orleans Metropolitan Area. Image Credit: NASA
Building Footprint Mappy Hour
Curious how ML-generated building datasets are created? Or how building datasets can be used to improve disaster response and resiliency in the US? Melanie Laverdiere of the Oak Ridge National Laboratory joined us for Mappy Hour on March 23 to share how they developed building structure datasets for the United States using machine learning and AI. Check out the recording below:
Do you have a great use case for how OSM building or parking lot data has been used? Share with us at team@openstreetmap.us and we’ll do our best to add it here.