The 12 Months of OpenStreetMap is an initiative led by OpenStreetMap US, and inspired by the Project of the Month done by map contributors in France, Switzerland, and Germany. The initiative is designed to engage the mapping community and volunteers around a new theme every month.
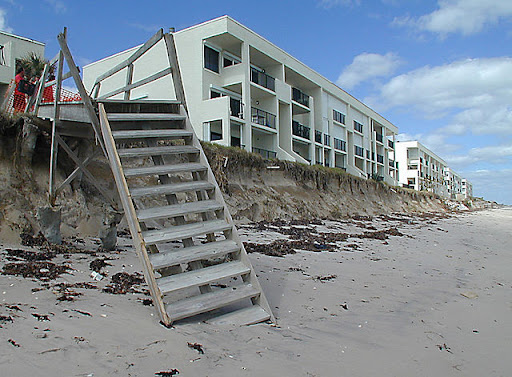
Coastal America faces extreme threats to the impacts of climate change and urbanization. As June is the official start of the Atlantic Hurricane Season, we ask mappers to focus on mapping features in support of resiliency for coastal communities. This data can be used by response actors, policy makers, and research analysts to understand the most vulnerable communities and infrastructure in the face of challenges such as sea level rise.
More than 8.6 million people in the United States are currently at risk to experience coastal flooding. With climate change increasing the frequency of storms and the rate of sea-level rise, the number of properties and individuals vulnerable to coastal storms and flooding is rising. Sophisticated models such as Flood Factor, bring together datasets (including OpenStreetMap) to identify who will experience the greatest impacts and therefore, can help planners and emergency responders identify who is most vulnerable to severe impacts. Help contribute to these datasets by mapping human and natural infrastructure in coastal areas.
Check out this great video on how OpenStreetMap is used to understand climate change impacts such as sea level rise:
What you can map
Use this brief guide to get started and what resources to use. Be sure to add #12MonthsofOSM to your changesets in June.
1. Mapping buildings in a coastal community
In OpenStreetMap, locate a coastal community near you, or one that you are familiar with that is unmapped or under mapped. Try to map a minimum of 25 buildings.
To map buildings, trace the outline of the building footprint as close to the building edges as feasible. Tag the area feature with building=yes and use the square function for rectangular buildings. Always use the building=yes tag UNLESS you can verify through local knowledge that the building is something more specific such as a school or fire station. More information can be found on the OSM Wiki here.
Tip: If you are unsure what community to map, use FEMA’s National Risk Index map to identify a community near you with high Coastal Flooding Risk.
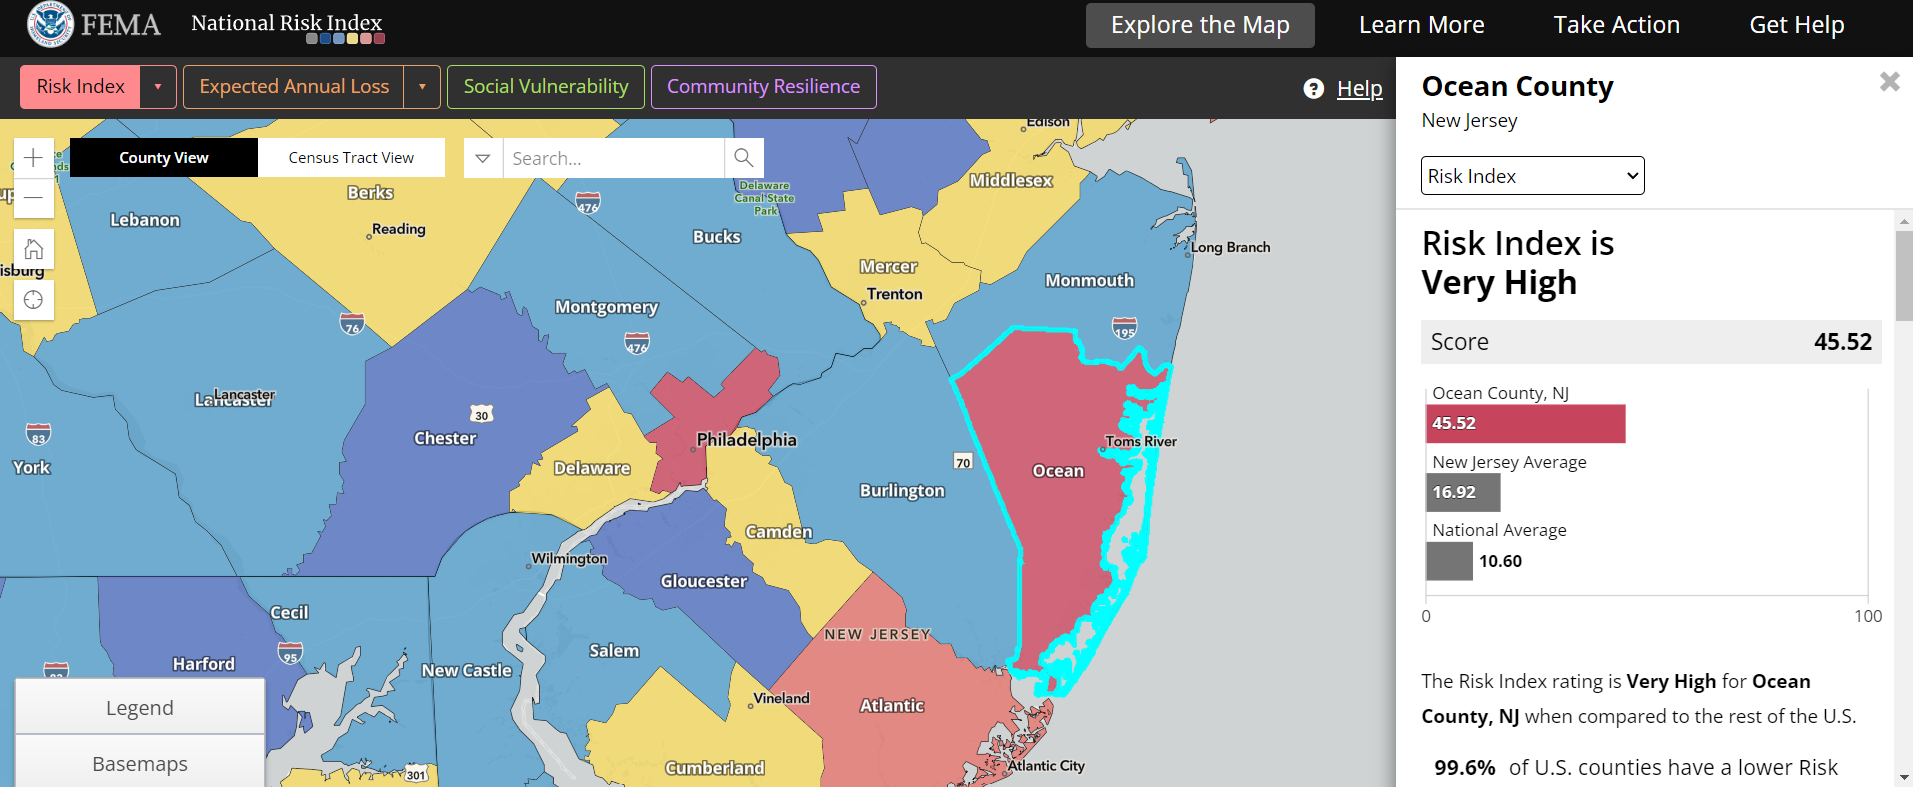
Image: FEMA National Risk Index
2. Road mapping in coastal areas
TIGER road data (from the US Census Bureau) was imported into OpenStreetMap in 2007. While this provided strong coverage of the United States with highway data, many tagging issues and inaccuracies were imported with this data, and portions of the data that still remains in OpenStreetMap may be out of date. This is particularly true outside of major cities.
In OpenStreetMap, locate a coastal community near you, or one that you are familiar with that is unmapped or under mapped. For these areas, review and fix road alignment of existing ways. Check for and map road segments that are currently missing, add the appropriate highway tag by referencing the OSM wiki.
Alternatively, help complete the coastal areas of this MapRoulette task for North Carolina:
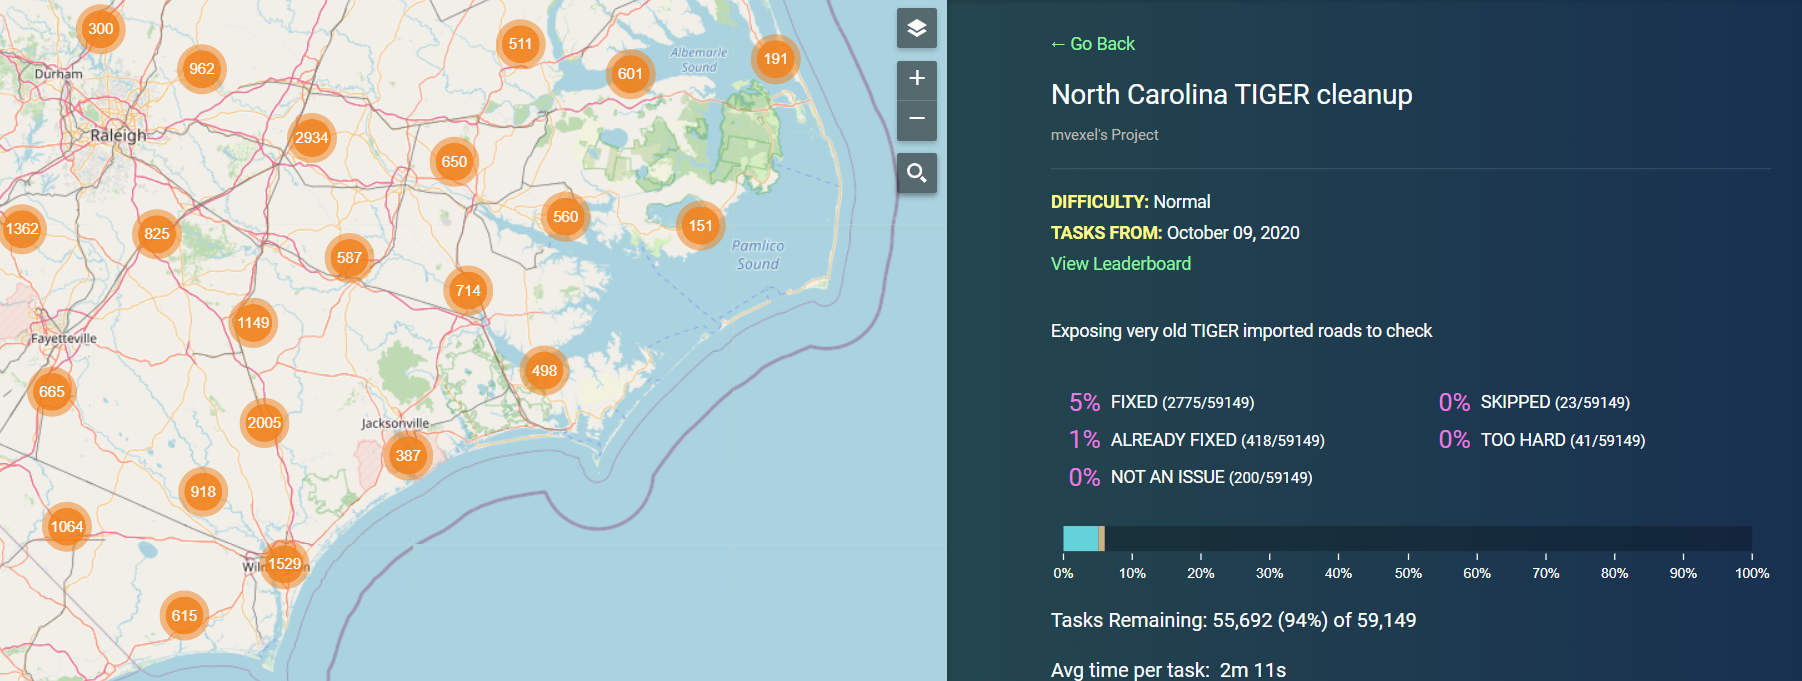
Image: Improving roads in North Carolina on MapRoulette
3. Mapping beaches and other natural infrastructure
Beaches, wetlands, marshes, and tidal estuaries all play a role in reducing the impacts of storm surge and sea level rise while providing habitat and other important ecological benefits. Map natural features and human access points:
-
Beaches can be mapped with the natural=beach tag. Consider other information if known such as access trails and points, if dogs are allowed (dog=yes, no) and any amenities such as toilets or showers.
-
Coastal wetlands, marshes, and tidal flats can be mapped with the natural=wetland tag. If you are familiar with the wetland, you can further add wetland=* to denote the type (i.e. tidalflat vs saltmarsh). More information can be found on the OSM wiki here on how to map wetlands. Add any visible amenities such as boardwalks and viewpoints that encourage responsible public use of the area.
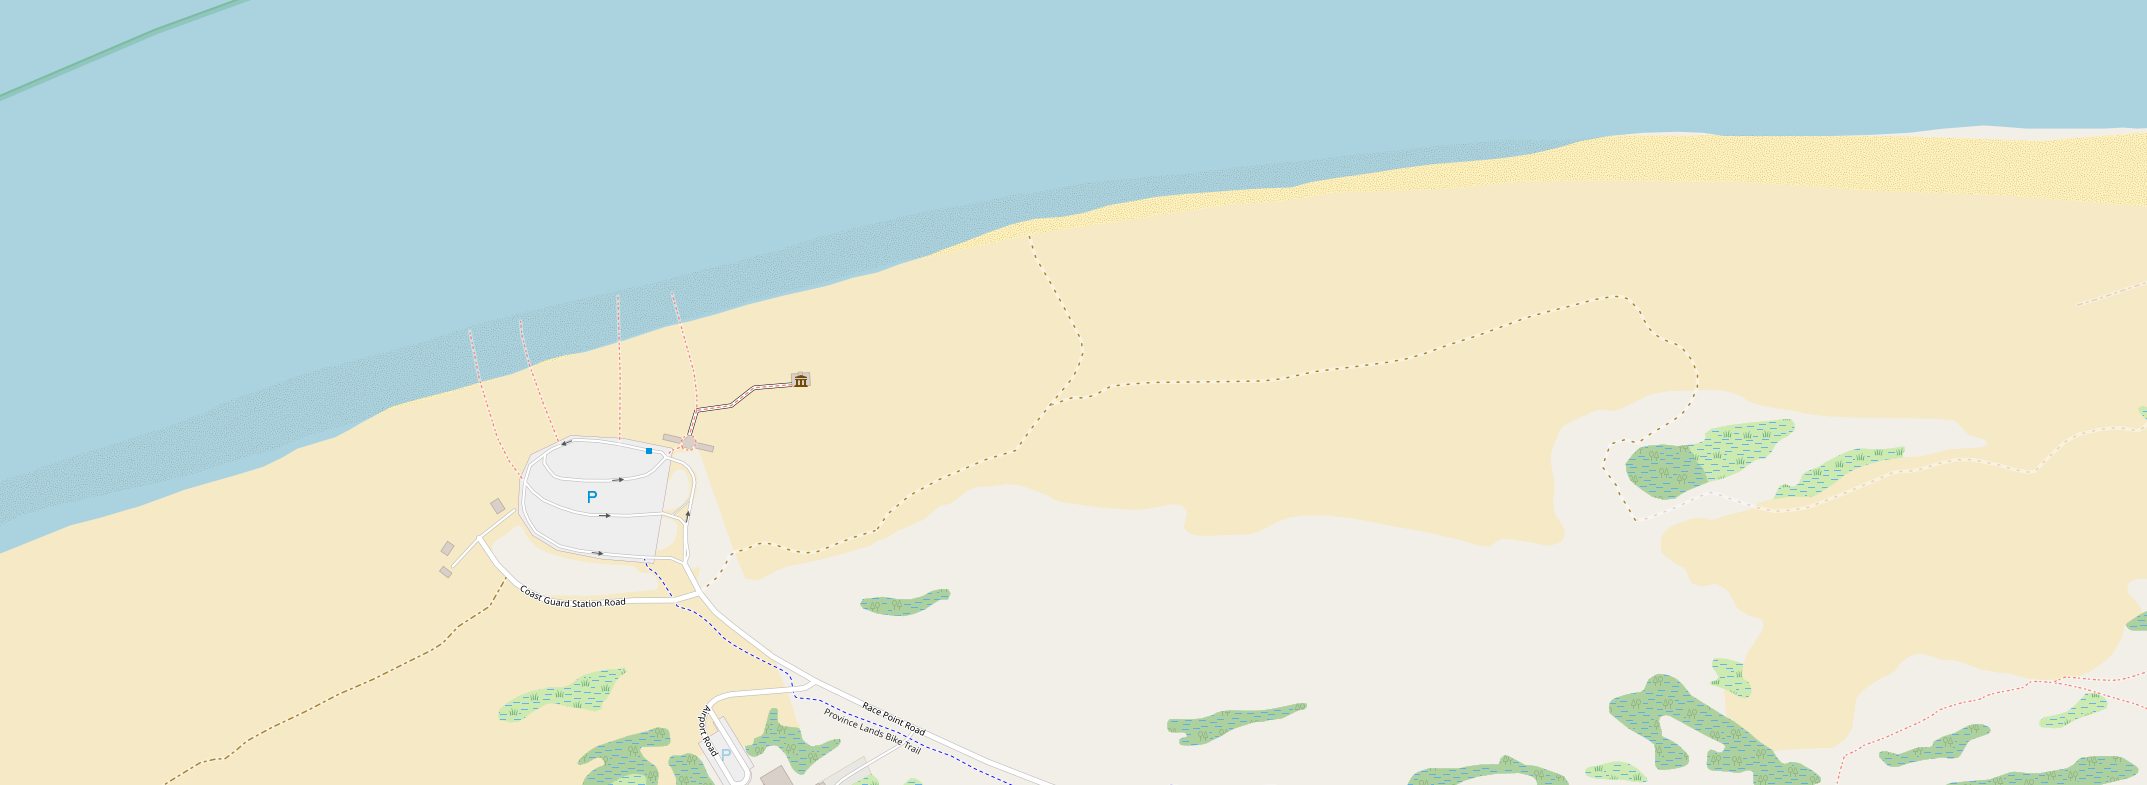
Image: Beach and infrastructure mapped on Cape Cod in OpenStreetMap
Remember to include #12MonthsofOSM in all your changesets.
Monthly Project
Each month in 2022, we’ll highlight (or set up) a project for the OpenStreetMap US community to gather around and map. This month, map buildings in Ocean County, New Jersey - ranked as the 3rd highest risk county for coastal flooding in FEMA’s National Risk Index.
Join us for Mappy Hour
This month’s Mappy Hour will focus on mapping Coastal America in OpenStreetMap. Join us on June 22 at 8pm ET register here.
Are we missing any great resources, recommendations or tips on mapping the coastal areas? Email us at team@openstreetmap.us and we’ll do our best to add your expertise here.