The 12 Months of OpenStreetMap is an initiative led by OpenStreetMap US, and inspired by the Project of the Month done by map contributors in France, Switzerland, and Germany. The initiative is designed to engage the mapping community and volunteers around a new theme every month.
With more than 1.35 million people killed from traffic-related deaths every year, road deaths have become a man-made humanitarian crisis. In response, this decade has been declared the Decade of Action for Road Safety by the UN General Assembly. Data, in particular map data, will be critical for policy decisions and infrastructure development in order to reach the UN’s goal of reducing road traffic deaths and injuries by 50% before 2030. At the local level, governments and partners are working to achieve Vision Zero - the goal of achieving zero traffic fatalities while improving equitable mobility for all. And at the neighborhood and district level, schools, nonprofits, and families are working to create Safe Routes to School for their children.
This month, contribute to OpenStreetMap to help improve the quality and quantity of critical map data needed for road safety improvement. Mapping traffic calming and pedestrian/bicycle safety infrastructure can help both Vision Zero and Safe Routes to School partners in understanding gaps in safety infrastructure and advocate for stronger planning.
What you can map
Use this brief guide to get started and what resources to use. Be sure to add #12MonthsofOSM to your changesets in November.
1. Mapping speed humps and other traffic calming features
Remotely map all speed humps in your local area or city. If all the speed humps are completely mapped in your local area, look for a nearby town or city that is incomplete. This can be done directly through an OpenStreetMap editor (i.e. iD or JOSM), however, creating and completing a project in the OSM US Tasking Manager can help with systematic completion.
To map speed humps, add a node to the HIGHWAY feature at the location of the speed hump. Tag the node with traffic_calming=hump. More information can be found on the OSM Wiki here.
Many traffic calming features, besides speed humps, can be difficult to view and map from satellite/aerial imagery. Some of these may include mini bumps, speed tables, and rumble strips. Review the list of traffic calming features that can be mapped and the relevant mapping instructions on the OSM wiki here.

An example of mapping a rumble strip on the OSM Wiki
2. Map pedestrian and bicycle safety features in your area
In addition to infrastructure designed to control vehicular traffic, infrastructure designed to protect pedestrians and cyclists is important to map for Vision Zero efforts.
-
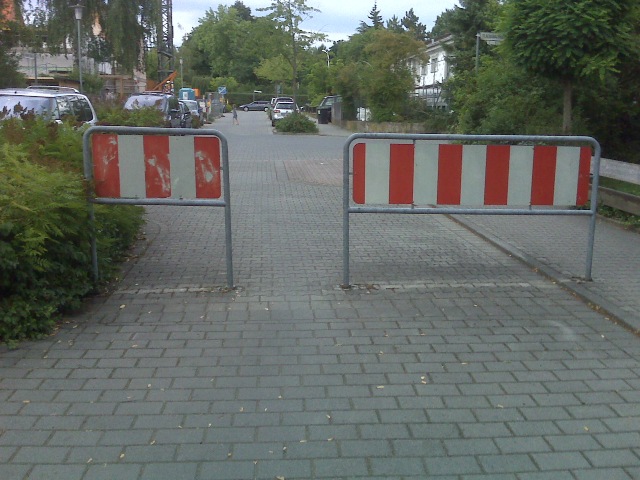
Cycle barriers slow cyclists and provide warning to pedestrians of a hazard such as a rail crossing or major highway. Map these features with barrier=cycle_barrier and read the OSM wiki for further instructions.
-
Bollards & vehicular barriers prevent vehicles from entering pedestrian and cyclist rights of way. These may include planters, bollards, and chains. Review the list of barriers on the OSM wiki here.
An example of traffic barrier on the OSM Wiki
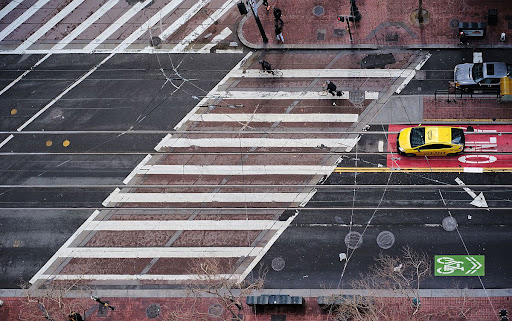
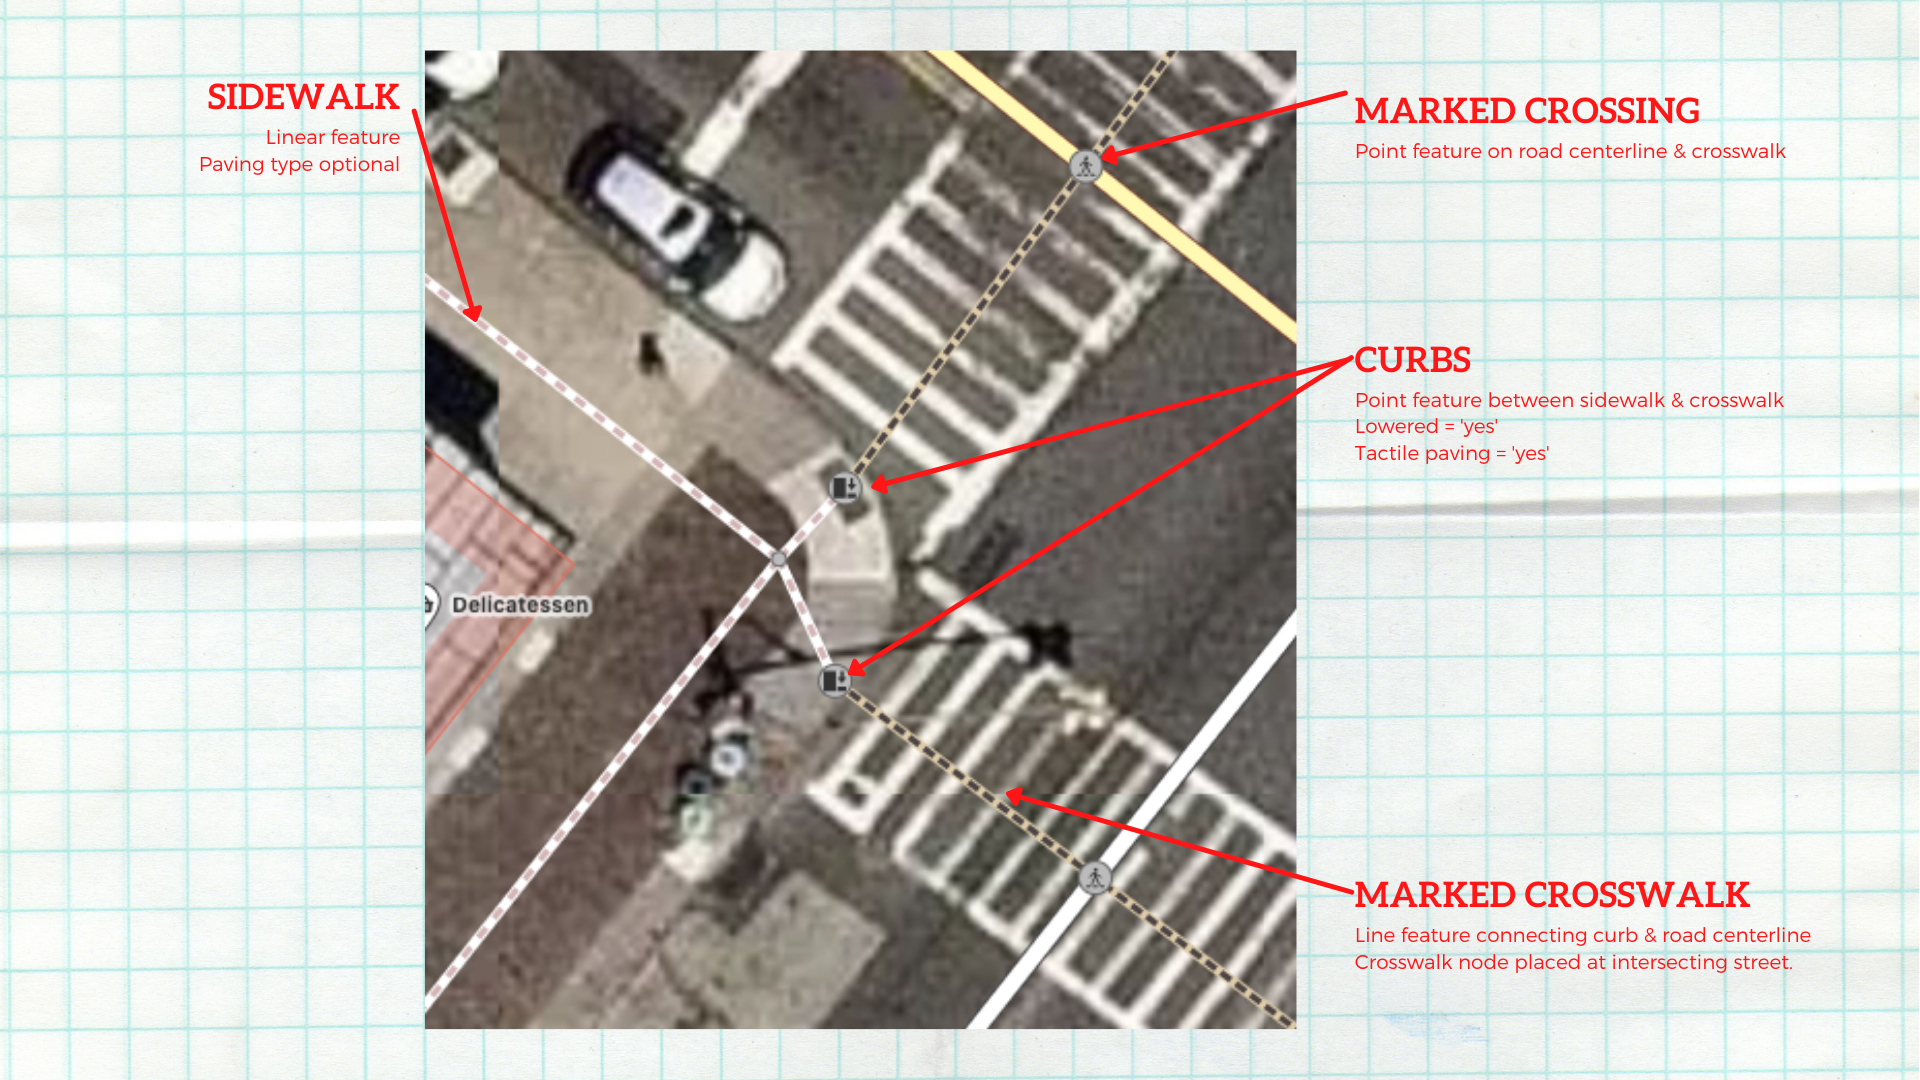
3. Mapping marked and unmarked crosswalks in your area
Complete the crosswalk network for your neighborhood. If your neighborhood is already completed, search for a nearby neighborhood that needs completing. To map crosswalks/crossings, connect sidewalk sections by adding a line down the center of the sidewalk, tagging with highway=footway AND footway=crossing. Crosswalks and sidewalks together should create a navigable network. More information can be found on the OSM Wiki here.
Remember to include #12MonthsofOSM in all your changesets.
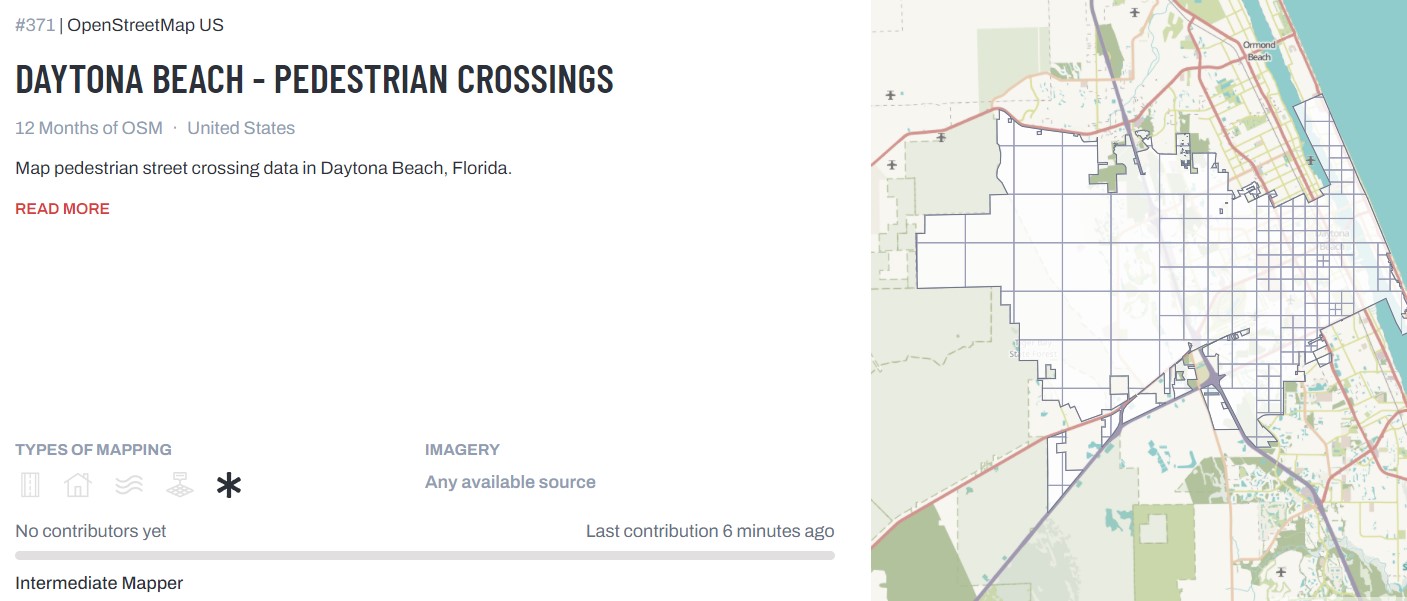
Monthly Project
Each month in 2022, we’ll highlight (or set up) a project for the OpenStreetMap US community to gather around and map. This month, help us improve road safety by mapping pedestrian crossings in Daytona Beach, Florida, ranked as the most dangerous city for pedestrians in the United States for 2022, by Smart Growth America.
Are we missing any great resources, recommendations or tips on mapping for road safety? Email us at team@openstreetmap.us and we’ll do our best to add your expertise here.